
- Home >
- Stock Photos >
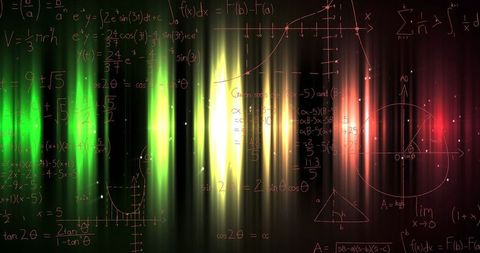
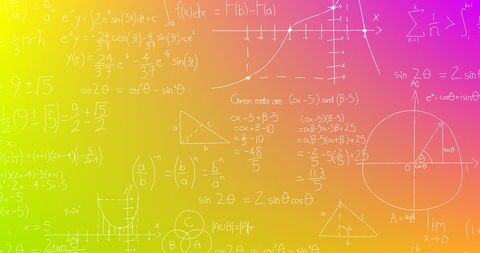
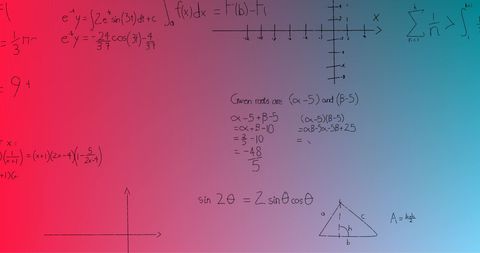
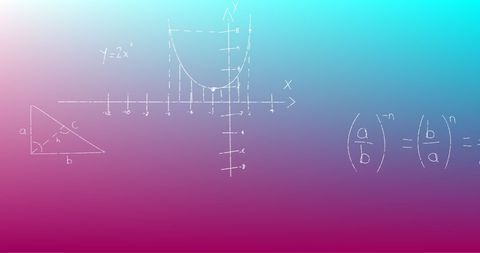
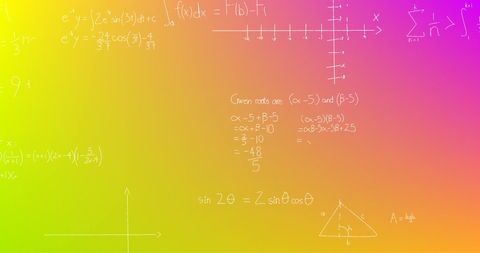
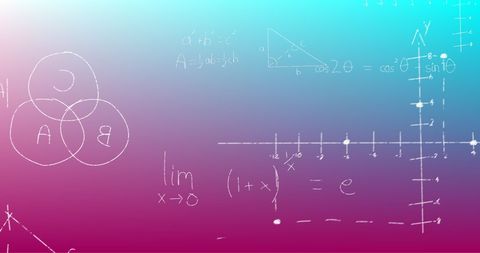
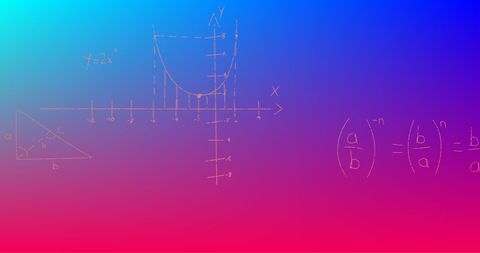
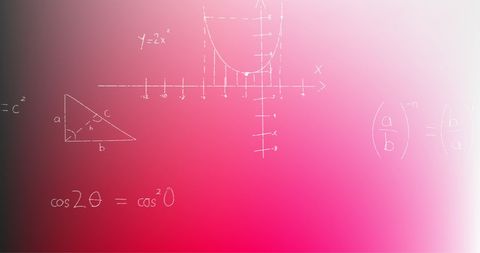
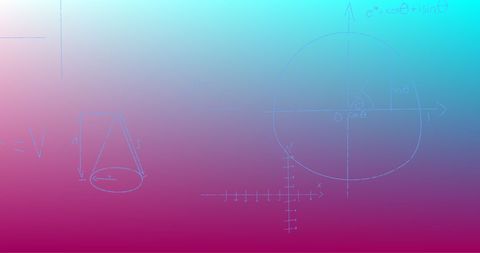
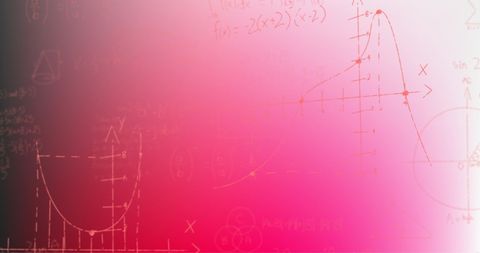
- Abstract Mathematical Formulae on Gradient Background
Abstract Mathematical Formulae on Gradient Background Image
This artistic visualization shows mathematical equations and diagrams over a vibrant gradient backdrop. With its abstract use of color and geometric shapes, this could be an inspirational piece for educational materials, science presentations, or decorative visuals capturing the beauty of mathematics and technology.

downloads
Tags:
More
Credit Photo
If you would like to credit the Photo, here are some ways you can do so
Text Link
photo Link
<span class="text-link">
<span>
<a target="_blank" href=https://pikwizard.com/photo/abstract-mathematical-formulae-on-gradient-background/9c886d7120a85e24802446b59255949a/>PikWizard</a>
</span>
</span>
<span class="image-link">
<span
style="margin: 0 0 20px 0; display: inline-block; vertical-align: middle; width: 100%;"
>
<a
target="_blank"
href="https://pikwizard.com/photo/abstract-mathematical-formulae-on-gradient-background/9c886d7120a85e24802446b59255949a/"
style="text-decoration: none; font-size: 10px; margin: 0;"
>
<img src="https://pikwizard.com/pw/medium/9c886d7120a85e24802446b59255949a.jpg" style="margin: 0; width: 100%;" alt="" />
<p style="font-size: 12px; margin: 0;">PikWizard</p>
</a>
</span>
</span>
Free (free of charge)
Free for personal and commercial use.
Author: Authentic Images
Similar Free Stock Images


AI


AI


AI


AI


AI


AI
AI


AI


AI


AI


AI


AI

AI


AI


Explore More Free Stock Images