- Home >
- Stock Photos >
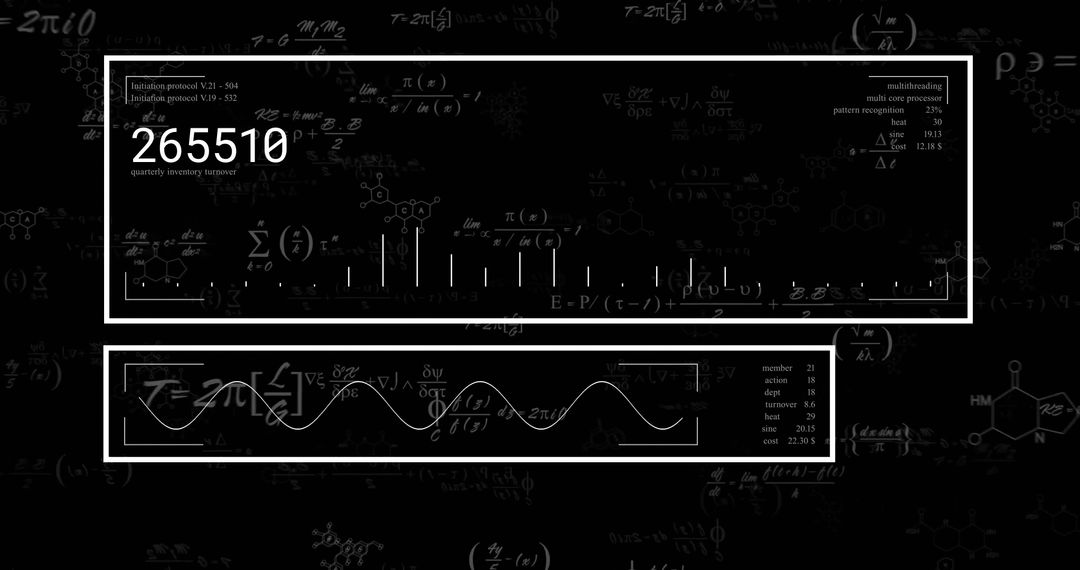
- Abstract Mathematics Financial Data Concept
Abstract Mathematics Financial Data Concept Image

Abstract representation of mathematics and financial data featuring equations and numbers. Useful for illustrating concepts in finance, data analytics, business calculations and educational materials related to mathematics or financial studies.
Powered by  - Get 15% off with code: PIKWIZARD15


2
downloads
downloads
Tags:
More
Credit Photo
If you would like to credit the Photo, here are some ways you can do so
Text Link
photo Link
<span class="text-link">
<span>
<a target="_blank" href=https://pikwizard.com/photo/abstract-mathematics-financial-data-concept/b4117159b54f10f6f4dca15793eda6ff/>PikWizard</a>
</span>
</span>
<span class="image-link">
<span
style="margin: 0 0 20px 0; display: inline-block; vertical-align: middle; width: 100%;"
>
<a
target="_blank"
href="https://pikwizard.com/photo/abstract-mathematics-financial-data-concept/b4117159b54f10f6f4dca15793eda6ff/"
style="text-decoration: none; font-size: 10px; margin: 0;"
>
<img src="https://pikwizard.com/pw/medium/b4117159b54f10f6f4dca15793eda6ff.jpg" style="margin: 0; width: 100%;" alt="" />
<p style="font-size: 12px; margin: 0;">PikWizard</p>
</a>
</span>
</span>
Free (free of charge)
Free for personal and commercial use.
Author: People Creations
Similar Free Stock Images

Premium


Premium


Premium


Premium


Premium


Premium


Premium


Premium


Premium


Premium


Premium


Premium


Premium


Premium


Premium


Premium


Premium


Premium


Premium


Premium


Premium


Premium


Premium


Premium