- Home >
- Stock Photos >
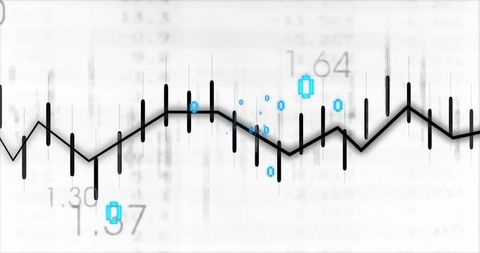
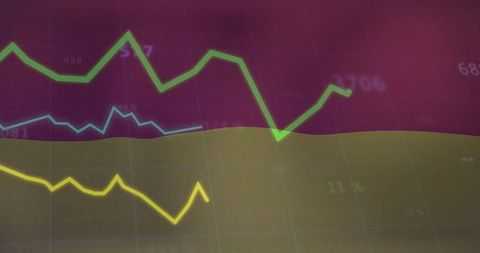
- Abstract Mathematics with Dynamic Graph Line Pattern
Abstract Mathematics with Dynamic Graph Line Pattern Image

Vibrant composition displaying mathematical equations and a dynamic orange line graph, symbolizing the integration of abstract mathematical concepts with real-life data analysis. Perfect for use in educational materials, scientific publications, or technology marketing to convey topics related to mathematics, finances, or scientific research.

downloads
Tags:
More
Credit Photo
If you would like to credit the Photo, here are some ways you can do so
Text Link
photo Link
<span class="text-link">
<span>
<a target="_blank" href=https://pikwizard.com/photo/abstract-mathematics-with-dynamic-graph-line-pattern/9fe75d927dff0168e30bb45ae520328e/>PikWizard</a>
</span>
</span>
<span class="image-link">
<span
style="margin: 0 0 20px 0; display: inline-block; vertical-align: middle; width: 100%;"
>
<a
target="_blank"
href="https://pikwizard.com/photo/abstract-mathematics-with-dynamic-graph-line-pattern/9fe75d927dff0168e30bb45ae520328e/"
style="text-decoration: none; font-size: 10px; margin: 0;"
>
<img src="https://pikwizard.com/pw/medium/9fe75d927dff0168e30bb45ae520328e.jpg" style="margin: 0; width: 100%;" alt="" />
<p style="font-size: 12px; margin: 0;">PikWizard</p>
</a>
</span>
</span>
Free (free of charge)
Free for personal and commercial use.
Author: Awesome Content