- Home >
- Stock Photos >
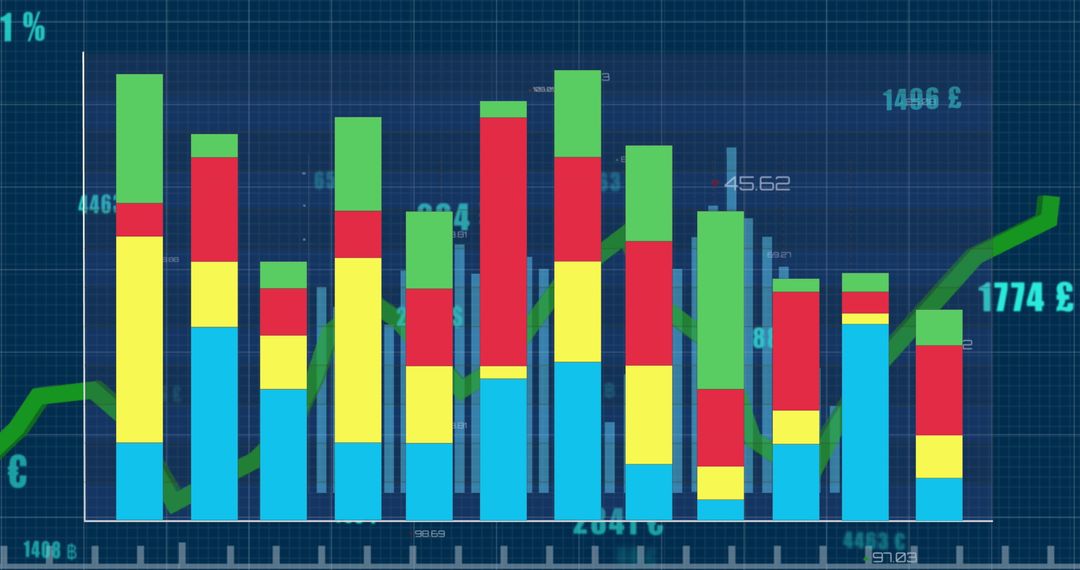
- Abstract Multicolored Graphs on Pink Background Illustrating Data Analysis
Abstract Multicolored Graphs on Pink Background Illustrating Data Analysis Image

This illustration depicts various multicolored bar and line graphs on a pink background. The image effectively conveys concepts of data analysis, business reports, and digital analytics. Suitable for presentations, marketing materials, and educational purposes in areas of data science and economics. The bright and vibrant colors make it an excellent choice for eye-catching print or online content.
Powered by 


2
downloads
downloads
Tags:
More
Credit Photo
If you would like to credit the Photo, here are some ways you can do so
Text Link
photo Link
<span class="text-link">
<span>
<a target="_blank" href=https://pikwizard.com/photo/abstract-multicolored-graphs-on-pink-background-illustrating-data-analysis/5c5d0549eeaa8fb27371365624ca77e0/>PikWizard</a>
</span>
</span>
<span class="image-link">
<span
style="margin: 0 0 20px 0; display: inline-block; vertical-align: middle; width: 100%;"
>
<a
target="_blank"
href="https://pikwizard.com/photo/abstract-multicolored-graphs-on-pink-background-illustrating-data-analysis/5c5d0549eeaa8fb27371365624ca77e0/"
style="text-decoration: none; font-size: 10px; margin: 0;"
>
<img src="https://pikwizard.com/pw/medium/5c5d0549eeaa8fb27371365624ca77e0.jpg" style="margin: 0; width: 100%;" alt="" />
<p style="font-size: 12px; margin: 0;">PikWizard</p>
</a>
</span>
</span>
Free (free of charge)
Free for personal and commercial use.
Author: Authentic Images
Similar Free Stock Images

Premium


Premium


Premium


Premium


Premium


Premium


Premium


Premium


Premium


Premium


Premium


Premium


Premium


Premium


Premium


Premium


Premium


Premium


Premium


Premium


Premium


Premium


Premium


Premium