- Home >
- Stock Photos >
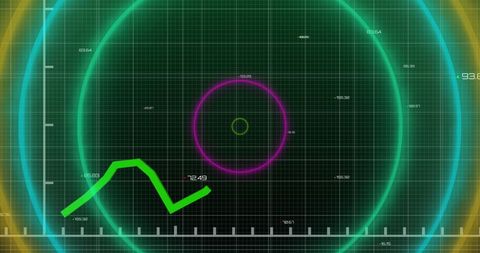
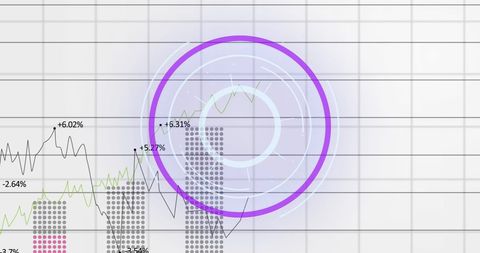
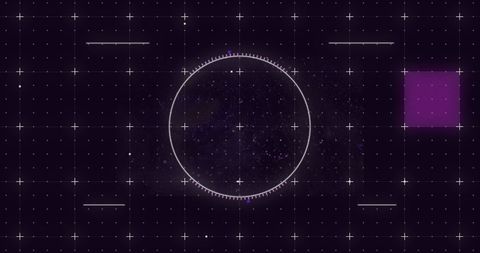
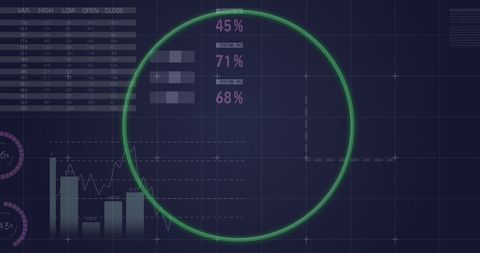
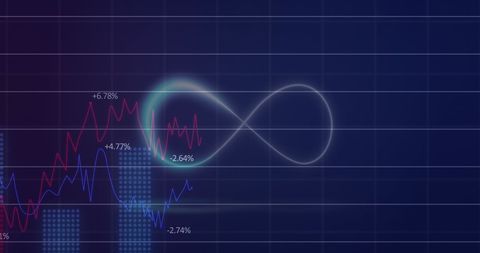
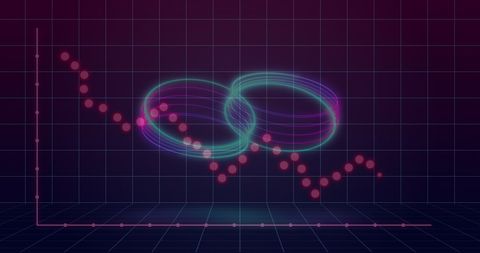
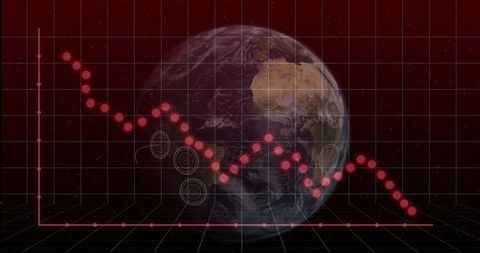
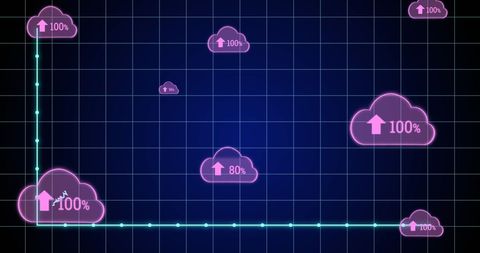
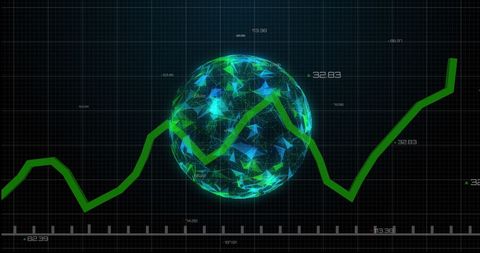
- Abstract Neon Data Visualization with Circular Elements
Abstract Neon Data Visualization with Circular Elements Image

Abstract representation of data visualization combining stacked area charts and circular graphs. The digital-style neon circles over a navy background suggest modern analytics applications. Ideal for illustrating concepts of technology, data science, futuristic interface designs, dashboards, or digital presentations.

downloads
Tags:
More
Credit Photo
If you would like to credit the Photo, here are some ways you can do so
Text Link
photo Link
<span class="text-link">
<span>
<a target="_blank" href=https://pikwizard.com/photo/abstract-neon-data-visualization-with-circular-elements/a4065d7fe587ff6cbfd38be8401b4815/>PikWizard</a>
</span>
</span>
<span class="image-link">
<span
style="margin: 0 0 20px 0; display: inline-block; vertical-align: middle; width: 100%;"
>
<a
target="_blank"
href="https://pikwizard.com/photo/abstract-neon-data-visualization-with-circular-elements/a4065d7fe587ff6cbfd38be8401b4815/"
style="text-decoration: none; font-size: 10px; margin: 0;"
>
<img src="https://pikwizard.com/pw/medium/a4065d7fe587ff6cbfd38be8401b4815.jpg" style="margin: 0; width: 100%;" alt="" />
<p style="font-size: 12px; margin: 0;">PikWizard</p>
</a>
</span>
</span>
Free (free of charge)
Free for personal and commercial use.
Author: Authentic Images