
- Home >
- Stock Photos >
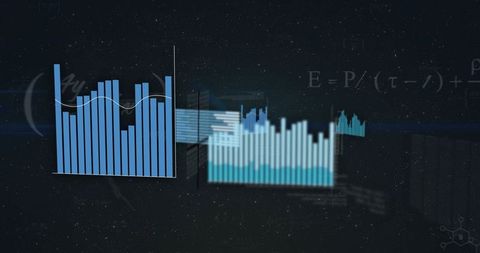
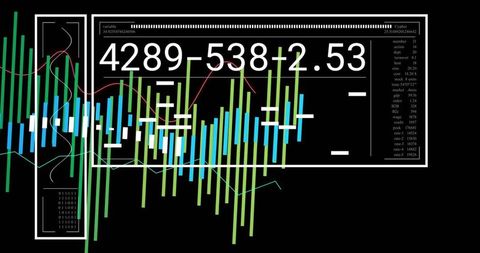
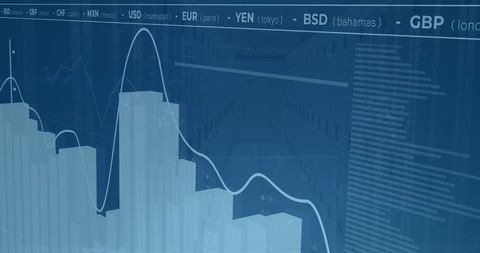
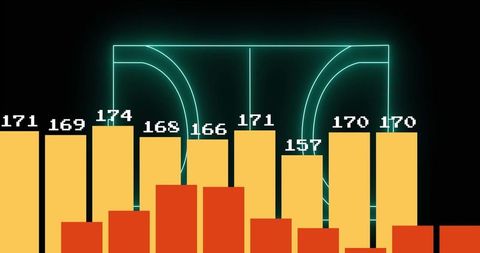
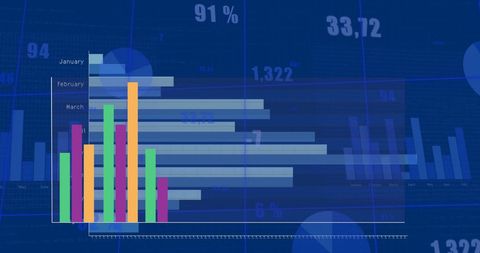
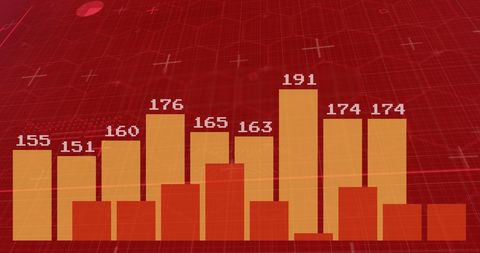
- Abstract Network Connections over Financial Data Visualization
Abstract Network Connections over Financial Data Visualization Image
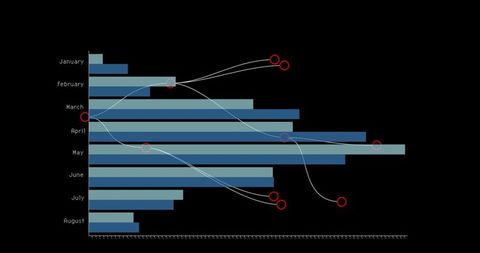
Digital artistry highlights financial data interconnectedness on dark background. Featured horizontal bar graphs representing financial performance over several months. Red nodes and white lines signify global business connections and data flow. Suitable educational presentations, financial technology interfaces, corporate digital dashboards.
Powered by 


downloads
Tags:
More
Credit Photo
If you would like to credit the Photo, here are some ways you can do so
Text Link
photo Link
<span class="text-link">
<span>
<a target="_blank" href=https://pikwizard.com/photo/abstract-network-connections-over-financial-data-visualization/dc5147459b3c54c9adda360faf23502e/>PikWizard</a>
</span>
</span>
<span class="image-link">
<span
style="margin: 0 0 20px 0; display: inline-block; vertical-align: middle; width: 100%;"
>
<a
target="_blank"
href="https://pikwizard.com/photo/abstract-network-connections-over-financial-data-visualization/dc5147459b3c54c9adda360faf23502e/"
style="text-decoration: none; font-size: 10px; margin: 0;"
>
<img src="https://pikwizard.com/pw/medium/dc5147459b3c54c9adda360faf23502e.jpg" style="margin: 0; width: 100%;" alt="" />
<p style="font-size: 12px; margin: 0;">PikWizard</p>
</a>
</span>
</span>
Free (free of charge)
Free for personal and commercial use.
Author: People Creations
Similar Free Stock Images

Premium


Premium


Premium


Premium


Premium


Premium


Premium


Premium

Premium


Premium


Premium

AI


Premium


Premium


Premium


Premium


Premium


Premium


Premium


Premium

Premium


Premium


AI

Premium

Premium


Premium

Premium

Explore More Free Stock Images