- Home >
- Stock Photos >
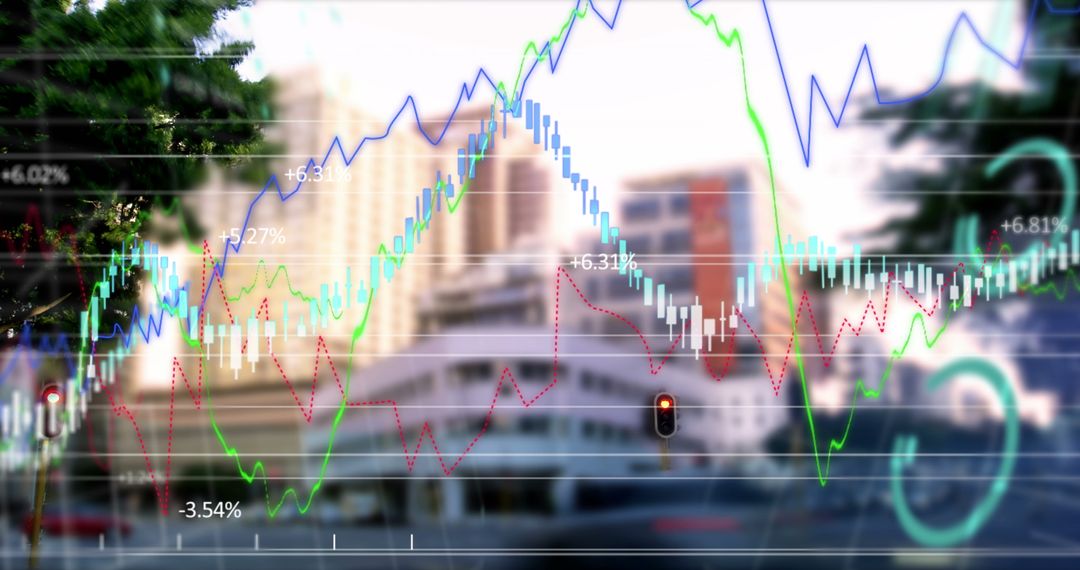
- Abstract Patterns of Stock Market Financial Data Graphs
Abstract Patterns of Stock Market Financial Data Graphs Image

Abstract image depicting data patterns superimposed over defocused lights, symbolizing digital integration with financial markets. Useful for presentations on finance, investment or cutting-edge technology. Ideal for illustrating concepts like global business, economic trends, or stock trading analytics.
Powered by 


4
downloads
downloads
Tags:
More
Credit Photo
If you would like to credit the Photo, here are some ways you can do so
Text Link
photo Link
<span class="text-link">
<span>
<a target="_blank" href=https://pikwizard.com/photo/abstract-patterns-of-stock-market-financial-data-graphs/04db915f79ec502a37f2fd3a5479687c/>PikWizard</a>
</span>
</span>
<span class="image-link">
<span
style="margin: 0 0 20px 0; display: inline-block; vertical-align: middle; width: 100%;"
>
<a
target="_blank"
href="https://pikwizard.com/photo/abstract-patterns-of-stock-market-financial-data-graphs/04db915f79ec502a37f2fd3a5479687c/"
style="text-decoration: none; font-size: 10px; margin: 0;"
>
<img src="https://pikwizard.com/pw/medium/04db915f79ec502a37f2fd3a5479687c.jpg" style="margin: 0; width: 100%;" alt="" />
<p style="font-size: 12px; margin: 0;">PikWizard</p>
</a>
</span>
</span>
Free (free of charge)
Free for personal and commercial use.
Author: Authentic Images
Similar Free Stock Images
Premium


Premium


Premium


Premium


Premium


Premium


Premium


Premium


Premium


Premium


Premium


Premium


Premium


Premium


Premium


Premium


Premium


Premium


Premium


Premium


Premium


Premium


Premium


Premium