- Home >
- Stock Photos >
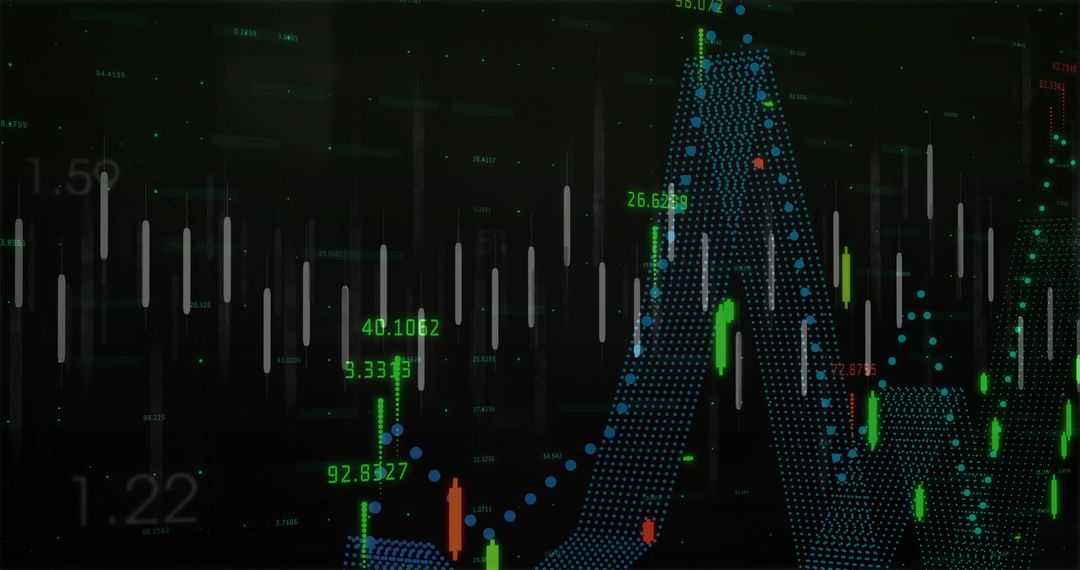
- Abstract Purple Wave Pattern Over Digital Stock Market Display
Abstract Purple Wave Pattern Over Digital Stock Market Display Image

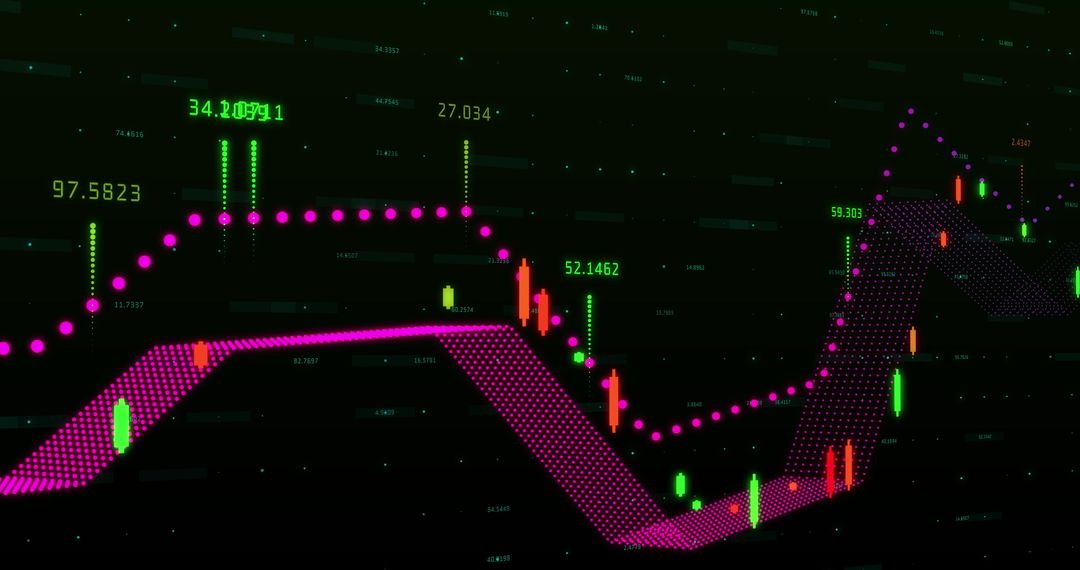
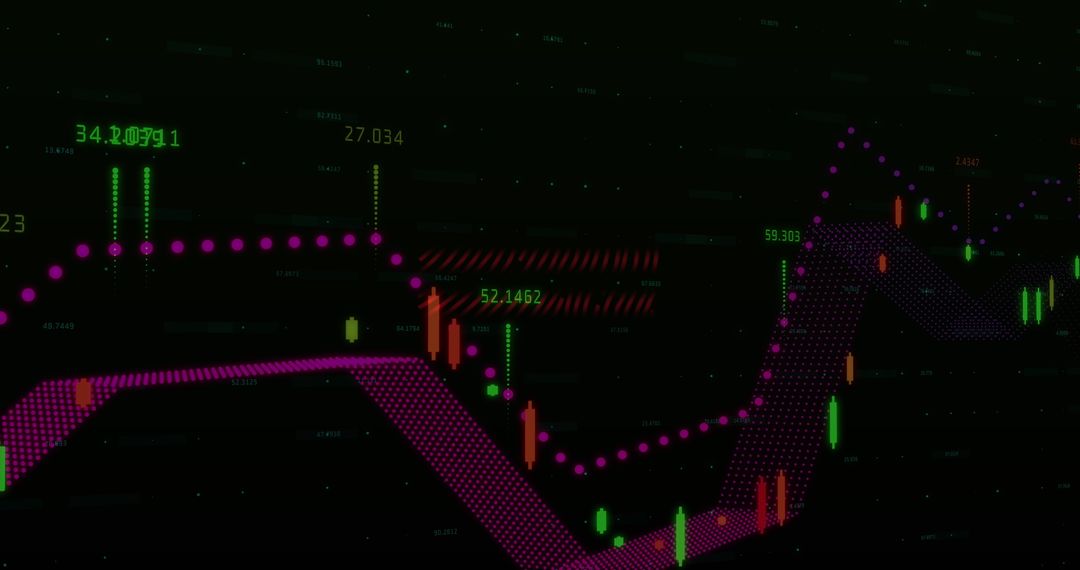
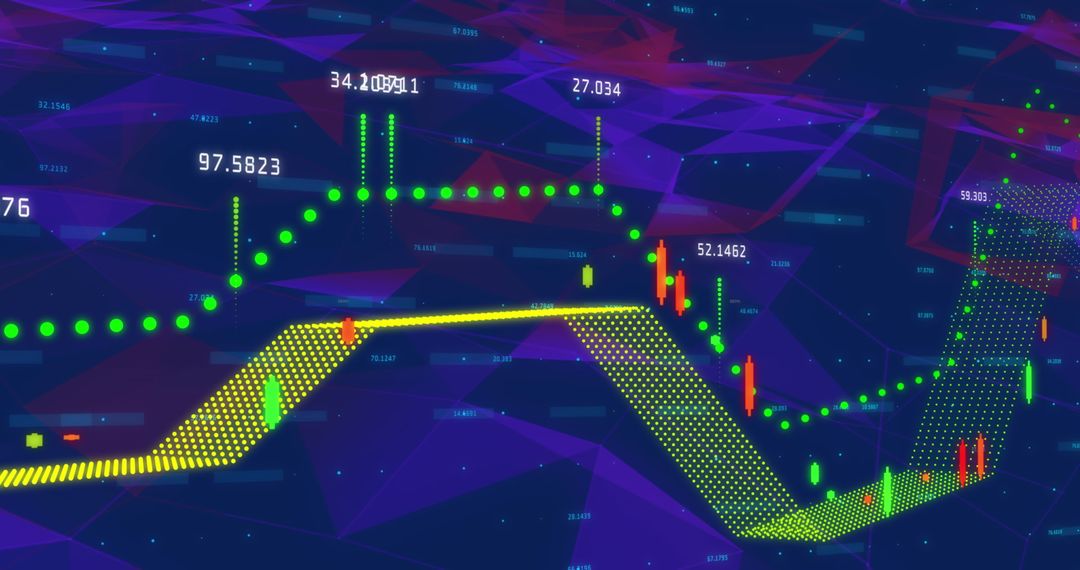
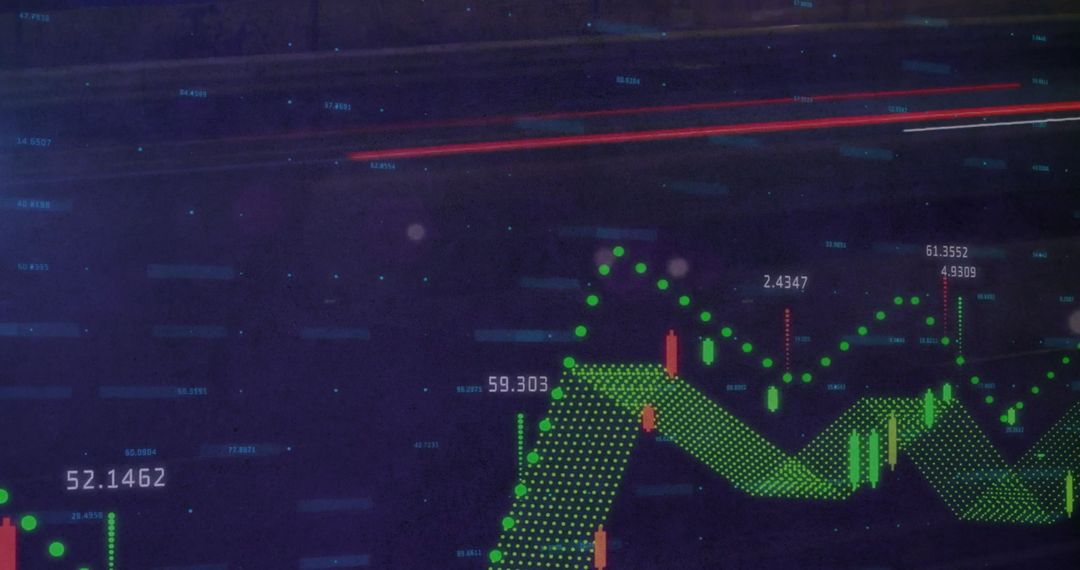
This digital illustration combines abstract art with stock market graphs, depicting movement and fluctuations in financial data. The purple wave pattern overlays traditional trading elements to emphasize a futuristic approach to analytics in technology-driven finance. Ideal for use in financial presentations, investment strategy articles, and fintech websites to visualize complex financial information creatively.
Powered by 


2
downloads
downloads
Tags:
More
Credit Photo
If you would like to credit the Photo, here are some ways you can do so
Text Link
photo Link
<span class="text-link">
<span>
<a target="_blank" href=https://pikwizard.com/photo/abstract-purple-wave-pattern-over-digital-stock-market-display/dfa1b7557ef7825e19d939a9a3f34a1b/>PikWizard</a>
</span>
</span>
<span class="image-link">
<span
style="margin: 0 0 20px 0; display: inline-block; vertical-align: middle; width: 100%;"
>
<a
target="_blank"
href="https://pikwizard.com/photo/abstract-purple-wave-pattern-over-digital-stock-market-display/dfa1b7557ef7825e19d939a9a3f34a1b/"
style="text-decoration: none; font-size: 10px; margin: 0;"
>
<img src="https://pikwizard.com/pw/medium/dfa1b7557ef7825e19d939a9a3f34a1b.jpg" style="margin: 0; width: 100%;" alt="" />
<p style="font-size: 12px; margin: 0;">PikWizard</p>
</a>
</span>
</span>
Free (free of charge)
Free for personal and commercial use.
Author: Creative Art
Similar Free Stock Images
Premium


Premium


Premium


Premium


Premium


Premium


Premium


Premium


Premium


Premium


Premium


Premium


Premium


Premium


Premium


Premium


Premium


Premium


Premium


Premium


Premium


Premium


Premium


Premium