- Home >
- Stock Photos >
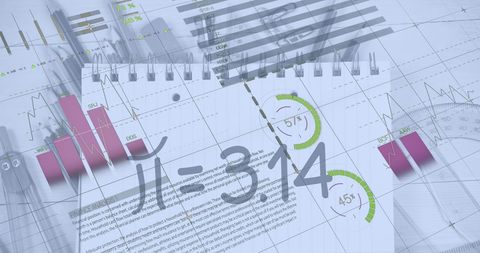
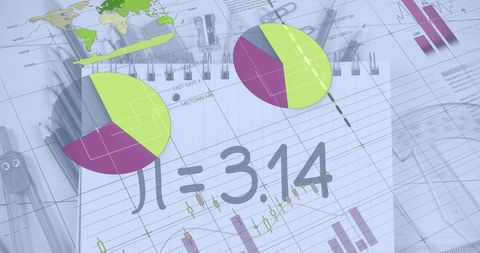
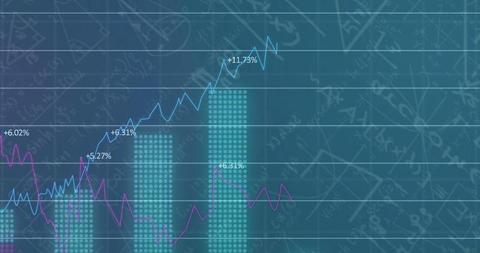
- Abstract Representation of Financial Analysis and Data Processing
Abstract Representation of Financial Analysis and Data Processing Image
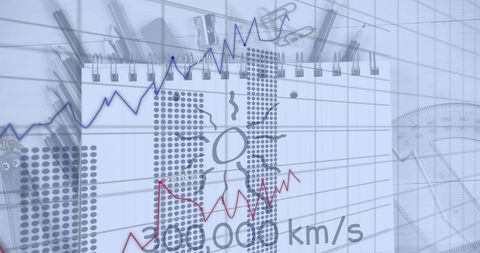
This abstract image combines elements of financial analysis and data processing with mathematical equations and graphs. It serves as a representation of global business operations, technological advancements, and innovative strategies in finance. Useful for publications, reports, or visual presentations related to economic studies, digital technology, or business intelligence.

downloads
Tags:
More
Credit Photo
If you would like to credit the Photo, here are some ways you can do so
Text Link
photo Link
<span class="text-link">
<span>
<a target="_blank" href=https://pikwizard.com/photo/abstract-representation-of-financial-analysis-and-data-processing/19da79214937cb1ac79ab8a305886972/>PikWizard</a>
</span>
</span>
<span class="image-link">
<span
style="margin: 0 0 20px 0; display: inline-block; vertical-align: middle; width: 100%;"
>
<a
target="_blank"
href="https://pikwizard.com/photo/abstract-representation-of-financial-analysis-and-data-processing/19da79214937cb1ac79ab8a305886972/"
style="text-decoration: none; font-size: 10px; margin: 0;"
>
<img src="https://pikwizard.com/pw/medium/19da79214937cb1ac79ab8a305886972.jpg" style="margin: 0; width: 100%;" alt="" />
<p style="font-size: 12px; margin: 0;">PikWizard</p>
</a>
</span>
</span>
Free (free of charge)
Free for personal and commercial use.
Author: People Creations