
- Home >
- Stock Photos >
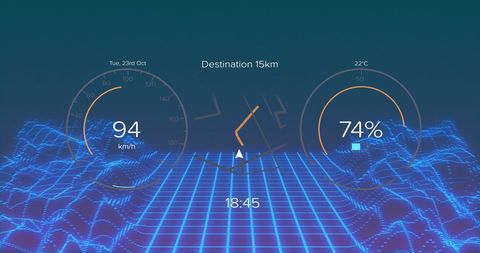
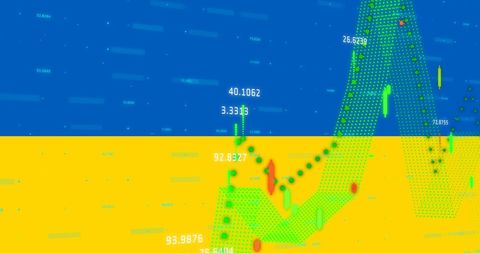
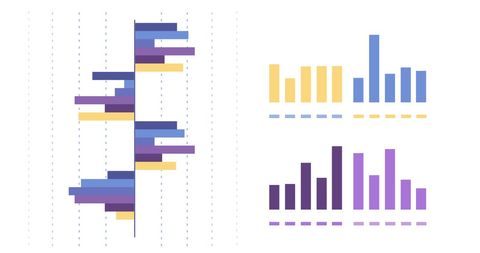
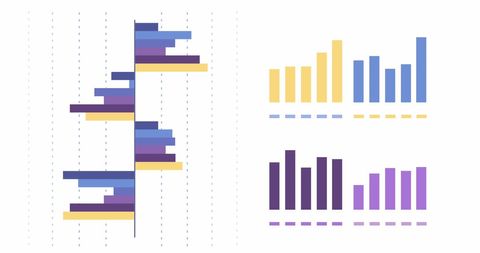
- Abstract Representation of Statistical Data Processing on Blue Background
Abstract Representation of Statistical Data Processing on Blue Background Image

Shows abstract graph bars in digital interface style exemplifying processing and visualization of statistical data against a blue backdrop. Useful in contexts related to business analysis, technology, data management, digital computing, or educational articles focusing on data technology advancements. Perfect for illustrating modern data processing techniques and analytics tools in presentations, reports, or industry wikis.
Powered by 


downloads
Tags:
More
Credit Photo
If you would like to credit the Photo, here are some ways you can do so
Text Link
photo Link
<span class="text-link">
<span>
<a target="_blank" href=https://pikwizard.com/photo/abstract-representation-of-statistical-data-processing-on-blue-background/0f4e5ea08519f9d07e171cf46cb742f3/>PikWizard</a>
</span>
</span>
<span class="image-link">
<span
style="margin: 0 0 20px 0; display: inline-block; vertical-align: middle; width: 100%;"
>
<a
target="_blank"
href="https://pikwizard.com/photo/abstract-representation-of-statistical-data-processing-on-blue-background/0f4e5ea08519f9d07e171cf46cb742f3/"
style="text-decoration: none; font-size: 10px; margin: 0;"
>
<img src="https://pikwizard.com/pw/medium/0f4e5ea08519f9d07e171cf46cb742f3.jpg" style="margin: 0; width: 100%;" alt="" />
<p style="font-size: 12px; margin: 0;">PikWizard</p>
</a>
</span>
</span>
Free (free of charge)
Free for personal and commercial use.
Author: People Creations
Similar Free Stock Images

Premium


Premium


Premium


Premium


Premium


Premium


Premium


Premium


Premium


Premium


Premium


Premium

Premium


Premium

Premium


Premium


Premium


Premium


Premium


Premium


Premium


Premium


Premium


AI


Premium


Premium


Explore More Free Stock Images