
- Home >
- Stock Photos >
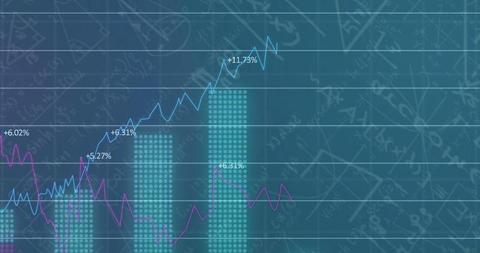
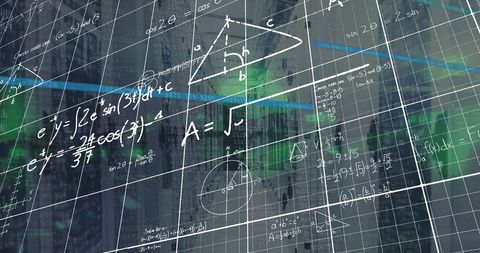
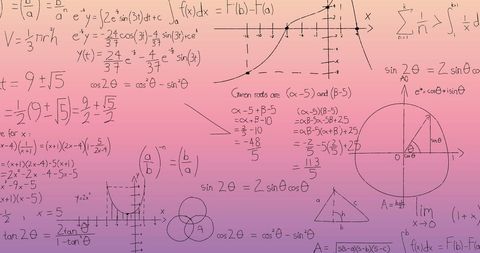
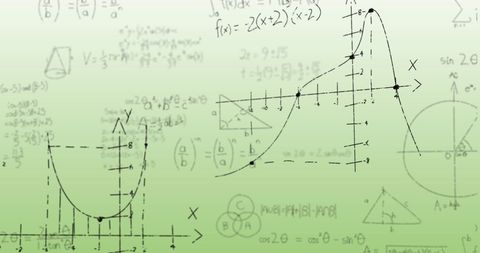
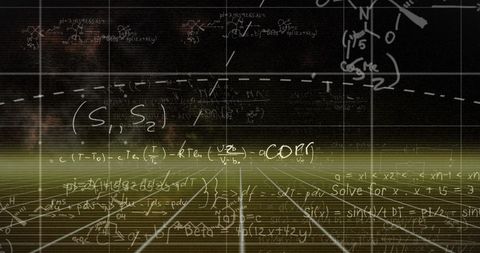
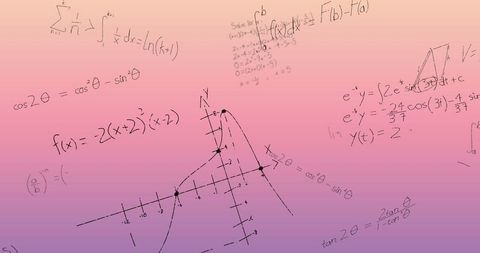
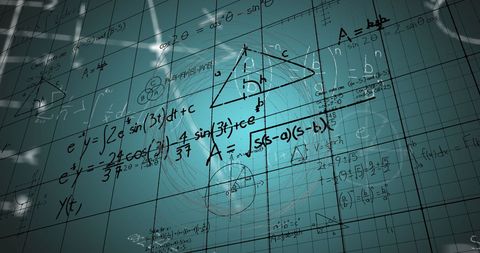
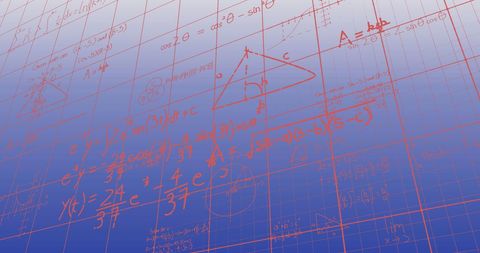
- Abstract Statistical Analysis Data with Mathematical Formulas
Abstract Statistical Analysis Data with Mathematical Formulas Image
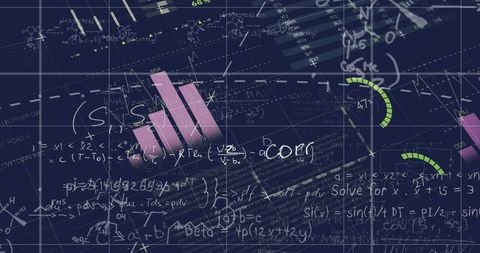
Visualization features charts and graphs with overlaid mathematical equations, illustrating concepts of statistical analysis and business intelligence. Ideal for websites offering educational content on data science, presentations on analytic methods, or promotional materials depicting scientific research and technology-focused enterprises.
Powered by 


downloads
Tags:
More
Credit Photo
If you would like to credit the Photo, here are some ways you can do so
Text Link
photo Link
<span class="text-link">
<span>
<a target="_blank" href=https://pikwizard.com/photo/abstract-statistical-analysis-data-with-mathematical-formulas/b3d94a16756b94bbde757e38334a73e2/>PikWizard</a>
</span>
</span>
<span class="image-link">
<span
style="margin: 0 0 20px 0; display: inline-block; vertical-align: middle; width: 100%;"
>
<a
target="_blank"
href="https://pikwizard.com/photo/abstract-statistical-analysis-data-with-mathematical-formulas/b3d94a16756b94bbde757e38334a73e2/"
style="text-decoration: none; font-size: 10px; margin: 0;"
>
<img src="https://pikwizard.com/pw/medium/b3d94a16756b94bbde757e38334a73e2.jpg" style="margin: 0; width: 100%;" alt="" />
<p style="font-size: 12px; margin: 0;">PikWizard</p>
</a>
</span>
</span>
Free (free of charge)
Free for personal and commercial use.
Author: Authentic Images
Similar Free Stock Images

Premium
Premium
Premium


Premium


Premium


Premium


Premium


Premium


Premium


Premium


Premium


Premium


Premium


Premium


Premium


Explore More Free Stock Images