1. Home > 
  2. Stock Photos > 
  3. Abstract Statistics and Graphs on Purple Background

Abstract Statistics and Graphs on Purple Background Image

Abstract Statistics and Graphs on Purple Background

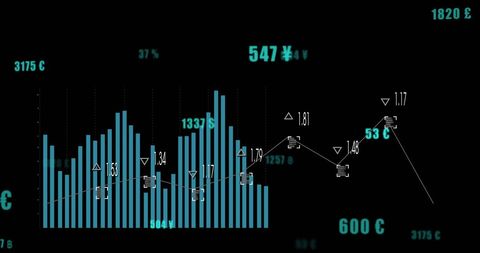
Abstract background shows graphical data overlayed on a purple gradient. Useful for presentations about financial growth, technological advancements, or business intelligence. Perfect for illustrating digital analysis or data science concepts.

Powered by Shutterstock logo - Get 15% off with code: PIKWIZARD15
Image of graphs and data over diverse female and male workers using. Global medicine and data processing during covid pandemic concept digitally generated image. - Powered by Shutterstock - Get 15% off with code: PIKWIZARD15Big data analytics with AI technology. Data analyst analyzing and visualizing complex information network with artificial intelligence. Machine learning algorithm for business analytics and finance. - Powered by Shutterstock - Get 15% off with code: PIKWIZARD15AI-Driven Workflow, Automating Data Management Analytics and Business Reports with KPIs, Predictive Insights, and Big Data Integration. Businessman touching Virtual Screen with Decision-Making Tech. - Powered by Shutterstock - Get 15% off with code: PIKWIZARD15Man look at the dashboard with graphs and charts. Concept of data management system, business intelligence, data statistics, marketing analysis, key performance indicators (KPI) and analytics. - Powered by Shutterstock - Get 15% off with code: PIKWIZARD15Man look at the dashboard with graphs and charts. Concept of data management system, business intelligence, data statistics, marketing analysis, key performance indicators (KPI) and analytics. - Powered by Shutterstock - Get 15% off with code: PIKWIZARD15

Credit Photo

If you would like to credit the Photo, here are some ways you can do so

Free (free of charge)

Free for personal and commercial use.

Author: People Creations

Similar Free Stock Images

Loading...
Financial Data Analysis with Bar and Line Graphs
Premium
Big data and AI technology, Business intelligence and AI data science, Automating data processing, Machine learning and business intelligence, AI driven data processing, KPI performance monitoring.
Abstract Colorful Bar Graph on Red Background
Financial Graphs Overlay on Ukrainian Flag Suggesting Economic Crisis
Premium
Businessman analyze and visualize complex information on a virtual screen using AI to process data. Big data technology and data science.Data flow.Digital neural network.artificial intelligence
Global Data Visualization Over Evening City Skyline
Digital Financial Analytics with Zero Percent Concept
Abstract Financial Charts in Futuristic Design
Digital Data Analysis Over Blue Background
Premium
Using tablet pc, Consultant between bookkeepers and accounting lawyer consultation about asset, balance sheet, stock market statistics and yearly tax law, protect business from bribery.
Diverse Graphical Data on Digital Financial Interface Concept
Futuristic Cyber Security Technology with Digital Data Display
Digital Financial Data Analysis on Global Map
Financial Data Visualization with Line and Bar Graphs
Digital Abstract Graph Showing Financial Growth and Currency Analysis
Digital Bar Graph with Blue Data Visualization
Financial Data Analysis with Trend Line and Statistics
Premium
Back rear view of young asian woman, freelance data scientist work remotely at home coding programing on Big data mining, AI data engineering, IT Technician Works on Artificial Intelligence Project.
Digital Growth Metrics with Dynamic Data Visualization
Colorful Graphical Data Analysis in Abstract Background
Digital Interface with Data Analysis Graphics on Blue Background
Colorful Financial Graph with Digital Technology Concept
Premium
Business Team Corporate Marketing Working Concept
Premium
Asia people expert woman AI deep tech talent working on project predict sales insight SEO graph chart plan visual big data science report center BI smart tools screen. Office worker asian analyst job.
Data Processing Visualization with Digital Charts on Blue Background
Financial Data Processing in Digital Interface Concept
Digital Bar and Line Chart with Financial Growth Analysis
Digital Financial Data Charts on Blue Background
Premium
Man Use Smartphone Hand,touch screen.Project Manager Researching Process.Business Team Work Startup modern Office.Global Strategy Virtual Icon.Innovation Graphs Interface.Analyze market stock.Blurred
Financial Data Analysis Graph on Blue Background Concept
Glowing cyan candlestick bars on dark red analytics grid with energy eco icons
Abstract Financial Data Visualization with Floating Numbers
Abstract Digital Financial Chart on Blue Interface
Dynamic Data Visualization on Digital Interface
Digital Data Visualization in Abstract Design
Dynamic Data Visualization Depicting Financial Growth Trends
Neon Blue Financial Bar Graph on Digital Grid Background
Premium
3D blue bar graph rising, sotck market informations
Premium
AI-Driven Workflow, Automating Business Reports with KPIs and Data Management Analytics, Big Data Integration, and Predictive Insights. Businessman touching Virtual Screen with Decision-Making Tech.
Premium
KPI key performance indicator business technology concept. Business executives use business news metrics to measure success against planned targets, Improving business process efficiency.
Digital Data Visualization with 3D Bar Graph
Data Analytics Graphs on Blue Digital Background
Dynamic Bars Overlapping Graph in Financial Analysis
Dynamic Financial Data Display in Digital Interface Over Black Background
Premium
Financial data on a monitor as Finance data concept. Analytics Report Status Information Analysis Chart Graph in digital screen. Business analyzing financial statistics displayed on the tablet screen.
Premium
Man Typing Keyboard Laptop Hand.Project Manager Researching Process.Business Team Working Startup modern Office.Global Strategy Virtual Icon.Innovation Graphs Interfaces.Analyze market stock.Blurred
Animated Financial Data with Heartbeat Overlapping Lines
Abstract Financial Charts with Colorful Holographic Effects
Business Professionals Analyzing Financial Data Graphs in Office
Financial Analytics with Chart and Graph Overlay on Digital Background
Premium
Finance marketing research reports paper close up, economic sales statistics documents lying on office desk, business people planning organization process
Abstract Graphical Data Representation in Blue Tones
Financial Data Analysis on Blue Digital Interface
Abstract Financial Charts and Data Visualizations
DNA Strand With Binary Code on Colorful Digital Background
Premium
Data driven concept with businessman use virtual touchscreens with data in graphs and trends to make decisions and implement marketing strategies to reach more customers
Premium
Image of graphs, data processing, icons over office buildings. Global network, data processing, finance, communication and technology concept digitally generated image.
Digital Financial Graphs and Data Analysis Visualization
Financial Data Processing Bar Graph on Minimalist Background
Dynamic Stock Market Graph with Fluctuating Data Bars
Digital Financial Chart and Global Currency Symbols on Blue Background
Encrypted waveform visualizing secure network traffic on futuristic digital dashboard UI
Digital Stock Market Pulse with Numbers on Blue Background
Futuristic Digital Data Analysis Visual with Line Graphs
Premium
Data analysis science and big data with AI technology. An analyst or Scientist uses a computer and dashboard to analyze information on complex data sets on a computer. Insights development engineer.
Premium
Analytics Report Status Information Analysis Chart Graph Concept
Financial Candlestick Chart on Digital Grid Background
Data Processing and Analytics Over Cityscape at Night
Futuristic Digital Financial Graph Interface with Zero Percent Indicator
Digital Display of Financial Data Analytics and Graphs
Digital Stock Market Data Over Cityscape Concept
Pink Graph and Data Analysis on 3D Grid for Financial Trends
3D Blue Bar Graph on Black Background Visualizing Data Trends
Financial Data Trend Analysis with Graphs on Green Background
Premium
KPI key performance indicator business technology concept. Business executives use business news metrics to measure success against planned targets, Improving business process efficiency.
Futuristic Data Analytics Over Digital Interface Background
Dynamic Colorful Wave Pattern on Dark Background
Digital Financial Data and Multicurrency Exchange Charts
Financial Data Analytics with Abstract Graphs and Currency Symbols
Digital Bar Graph on Dark Global Business Interface
Premium
Analytics Report Status Information Analysis Chart Graph Concept
Dynamic Forex Market Chart with Multiple Currencies and Growth Trends
Digital Data Chart Visualization in Modern Office Environment
Digital Finance Data with Icon Overlay on Blue Background
Dynamic Visualization of Financial Data and Analysis
Digital Financial Graphs and Stock Market Data Visualization
Dynamic Data Graph with Futuristic Technology Background
Digital Finance Data and Statistical Graphs on Dark Background
Binary Coding and Digital Data Visualization Concept
Premium
Image of graphs, data processing, icons and globe on blue background. Global network, data processing, finance, communication and technology concept digitally generated image.
Digital Data Visualization with Graph Over Red Background
Abstract Financial Data Analysis on Blue Digital Background
Digital Candlestick Chart on Virtual Grid in Blue Tone
Premium
KPI key performance indicator business technology concept. Business executives use business news metrics to measure success against planned targets, Improving business process efficiency.
Dynamic Display of Real-Time Data and Digital Analytics
Abstract Data Graph Infographic on Purple Gradient Background
Abstract Data Visualization on Red Background
Abstract Data Processing Visualization on Blue Gradient
Dynamic Financial Graph with Green and Red Candles
Colourful Digital Data Stream with Binary Code
Financial Graphs on Digital Screen with Circles and Zero Percent Display
Futuristic Data Visualization Bar Graph Concept
Financial Growth Trends Over Cityscape Background
Candlestick Chart with Moving Averages on Dark Background
Abstract Cityscape with Blue and Pink Data Graphs Overlay
Premium
Back rear view of young asian woman, freelance data scientist work remotely at home coding programmer on Big data mining, AI data engineering, IT Technician Works on Artificial Intelligence Project.
Global Financial Data Analysis on digital map backdrop exploring trends and insights
Abstract Financial Data and Graphs on Black Background
Green Line Chart with Financial Data on Digital Display
Abstract Data Visualization with Bar and Line Graphs on Network Grid
Premium
A professional examines digital analytics through an interactive screen, showcasing vital statistics and graphs, emphasizing the integration of technology in data analysis for informed decision-making
Data Analytics with Stylized Blue Graph Lines Visual
Financial Data Analysis on Transparent Grid Background
Digital Data Analytics with Financial Graphs and Indigo Background
Digital Financial Graphs and Data Visualization on Red Background
Premium
Beautiful 3D red bar graph fall down following the arrow.
Abstract Stock Market and Data Analysis in Purple Hue
Abstract Digital Finance Background with Graphs and Data Visualization
Financial Data Analysis with Digital Graph Overlay
Green Line Chart Overlay on Dark Financial Data Background
Global Data Processing with Abstract Graph and Network
Digital Financial Data Analysis on Dark Background
Financial Growth Bar and Line Graph on Digital Background
Futuristic Digital Data Analysis Background with Bar Graphs
Premium
Analytical data and development statistics. Web analytics and product testing techniques are being measured. A guy studies an SEO dashboard and a digital report.