
- Home >
- Stock Photos >
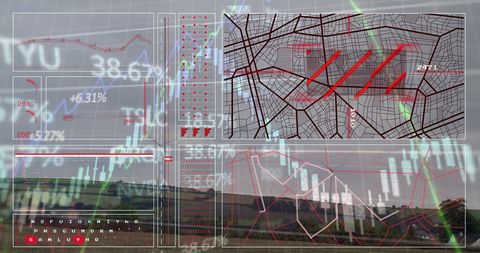
- Abstract Stock Market Data and Graphs Interface
Abstract Stock Market Data and Graphs Interface Image

Digital rendering of various financial statistics and fluctuating line graphs on a screen, representing real-time stock market data. Perfect for illustrating economic reports, finance apps, or platforms engaging viewers in stock trading education. Ideal for commercials about investment, global markets, or economic analysis.
Powered by  - Get 15% off with code: PIKWIZARD15


downloads
Tags:
More
Credit Photo
If you would like to credit the Photo, here are some ways you can do so
Text Link
photo Link
<span class="text-link">
<span>
<a target="_blank" href=https://pikwizard.com/photo/abstract-stock-market-data-and-graphs-interface/076eed20e26ca7a09ab8a446d196624e/>PikWizard</a>
</span>
</span>
<span class="image-link">
<span
style="margin: 0 0 20px 0; display: inline-block; vertical-align: middle; width: 100%;"
>
<a
target="_blank"
href="https://pikwizard.com/photo/abstract-stock-market-data-and-graphs-interface/076eed20e26ca7a09ab8a446d196624e/"
style="text-decoration: none; font-size: 10px; margin: 0;"
>
<img src="https://pikwizard.com/pw/medium/076eed20e26ca7a09ab8a446d196624e.jpg" style="margin: 0; width: 100%;" alt="" />
<p style="font-size: 12px; margin: 0;">PikWizard</p>
</a>
</span>
</span>
Free (free of charge)
Free for personal and commercial use.
Author: Awesome Content
Similar Free Stock Images

Premium


Premium

Premium


Premium

Premium


Premium

Premium


Premium

Premium


Premium


Premium

Premium

Premium


Premium

Premium

Premium


Premium

Premium


Premium


Premium


Premium


Premium

Premium


Premium


Premium

Explore More Free Stock Images