
- Home >
- Stock Photos >
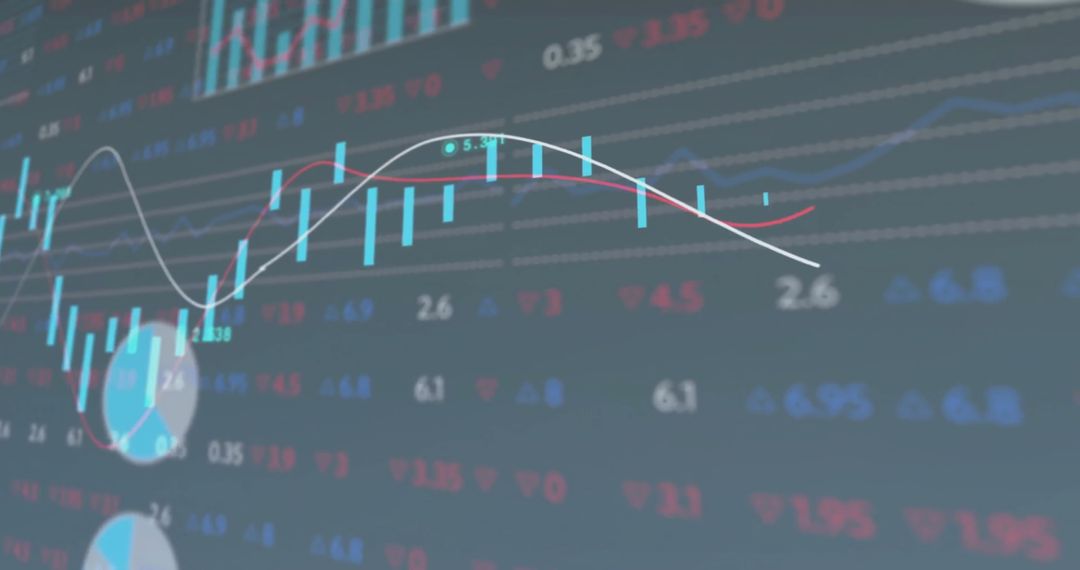
- Abstract Stock Market Data Innovation with Bar and Line Graphs
Abstract Stock Market Data Innovation with Bar and Line Graphs Image

Digital representation of stock market data showcases graphs and trends on a blue dark radar style background. May be used for illustrating themes related to finance, technology innovation, and data analytics professions. Excellent for enhancing content in reports, seminars, or financial industry presentations.
Powered by 


2
downloads
downloads
Tags:
More
Credit Photo
If you would like to credit the Photo, here are some ways you can do so
Text Link
photo Link
<span class="text-link">
<span>
<a target="_blank" href=https://pikwizard.com/photo/abstract-stock-market-data-innovation-with-bar-and-line-graphs/983a3935da3a12f1ff9ba89e5c85f37b/>PikWizard</a>
</span>
</span>
<span class="image-link">
<span
style="margin: 0 0 20px 0; display: inline-block; vertical-align: middle; width: 100%;"
>
<a
target="_blank"
href="https://pikwizard.com/photo/abstract-stock-market-data-innovation-with-bar-and-line-graphs/983a3935da3a12f1ff9ba89e5c85f37b/"
style="text-decoration: none; font-size: 10px; margin: 0;"
>
<img src="https://pikwizard.com/pw/medium/983a3935da3a12f1ff9ba89e5c85f37b.jpg" style="margin: 0; width: 100%;" alt="" />
<p style="font-size: 12px; margin: 0;">PikWizard</p>
</a>
</span>
</span>
Free (free of charge)
Free for personal and commercial use.
Author: Authentic Images
Similar Free Stock Images

Premium


Premium


Premium


Premium


Premium


Premium


Premium


Premium


Premium


Premium


Premium


Premium


Premium


Premium


Premium


Premium


Premium


Premium


Premium


Premium


Premium


Premium


Premium


Premium

