
- Home >
- Stock Photos >
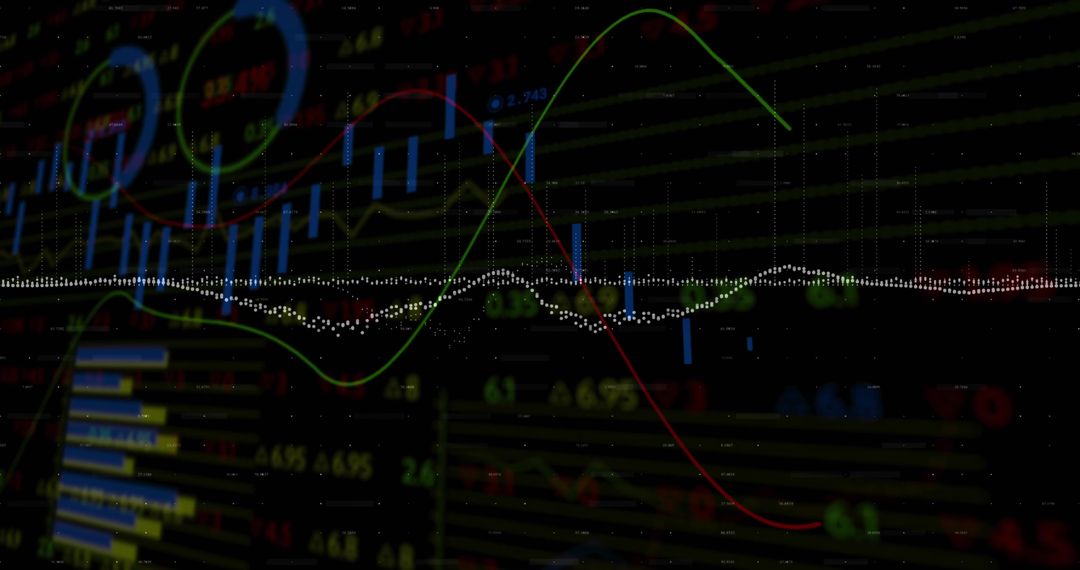
- Abstract Stock Market Data Visualization with Charts and Figures
Abstract Stock Market Data Visualization with Charts and Figures Image

This image features an abstract representation of stock market data, showcasing various charts and figures that imply financial analysis and data visualization concepts. It is suitable for articles and presentations on stocks, economic trends, or digital financial services. Perfect for illustrating business performance, economic forecasts, or trading platform introductions.
Powered by  - Get 15% off with code: PIKWIZARD15


2
downloads
downloads
Tags:
More
Credit Photo
If you would like to credit the Photo, here are some ways you can do so
Text Link
photo Link
<span class="text-link">
<span>
<a target="_blank" href=https://pikwizard.com/photo/abstract-stock-market-data-visualization-with-charts-and-figures/4de759f686a42bba5cbf950a1b1db1c5/>PikWizard</a>
</span>
</span>
<span class="image-link">
<span
style="margin: 0 0 20px 0; display: inline-block; vertical-align: middle; width: 100%;"
>
<a
target="_blank"
href="https://pikwizard.com/photo/abstract-stock-market-data-visualization-with-charts-and-figures/4de759f686a42bba5cbf950a1b1db1c5/"
style="text-decoration: none; font-size: 10px; margin: 0;"
>
<img src="https://pikwizard.com/pw/medium/4de759f686a42bba5cbf950a1b1db1c5.jpg" style="margin: 0; width: 100%;" alt="" />
<p style="font-size: 12px; margin: 0;">PikWizard</p>
</a>
</span>
</span>
Free (free of charge)
Free for personal and commercial use.
Author: Awesome Content
Similar Free Stock Images

Premium


Premium


Premium


Premium


Premium


Premium


Premium


Premium


Premium


Premium


Premium


Premium


Premium


Premium


Premium


Premium


Premium


Premium


Premium


Premium


Premium


Premium


Premium


Premium

