- Home >
- Stock Photos >
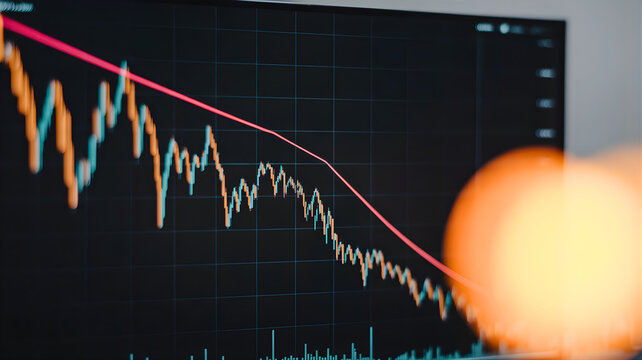
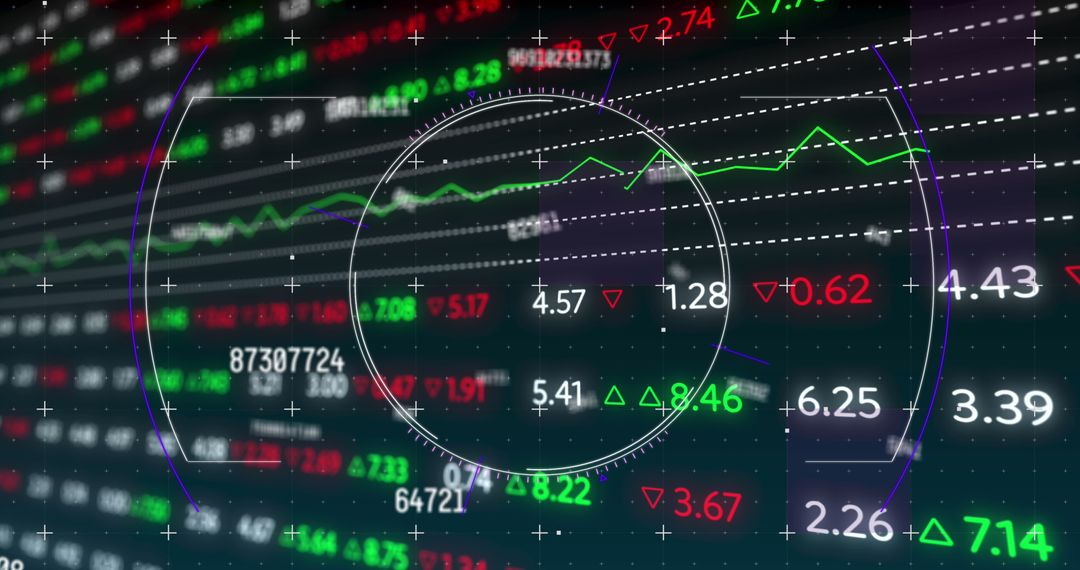
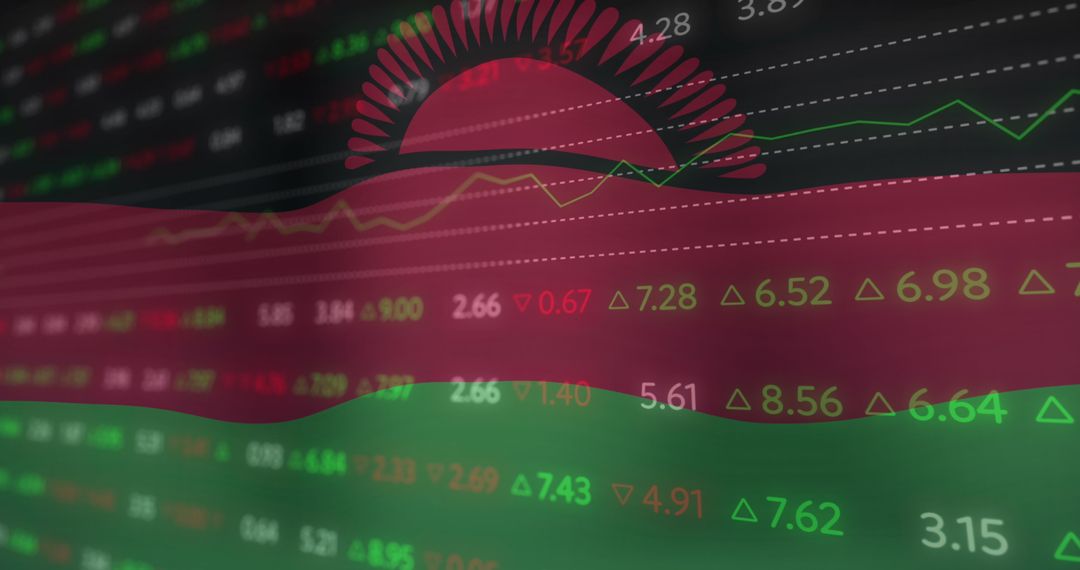
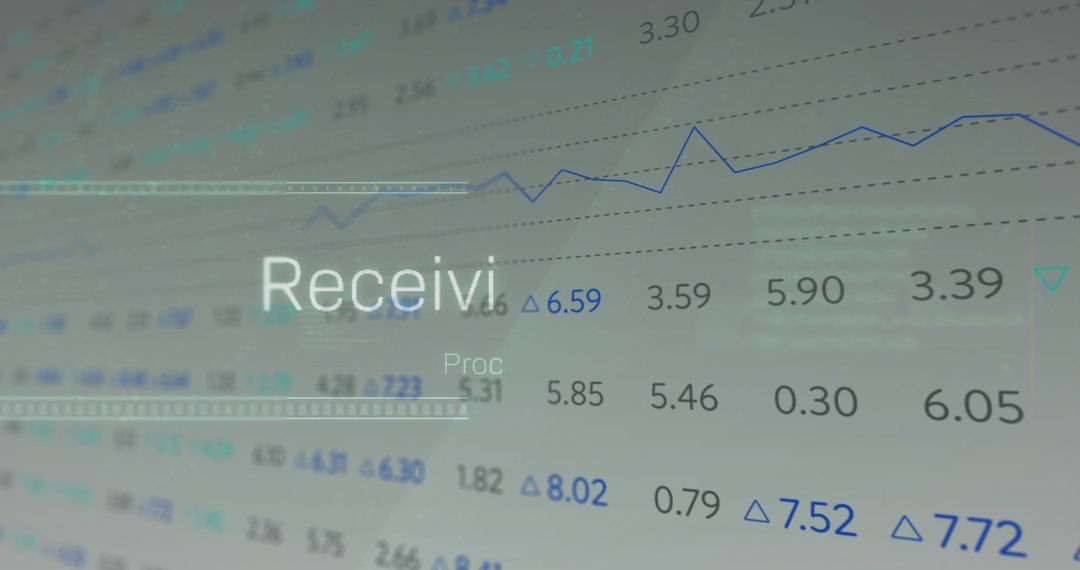
- Abstract Stock Market Data with Fluctuating Graphs
Abstract Stock Market Data with Fluctuating Graphs Image

Visual depiction of stock market performance highlights various graphs and floating numbers representing dynamic financial statistics. Ideal for finance blogs, investment reports, economic analysis content, and presentations on business growth or market trends. Useful as a background for discussions on stock performance and analytics.
Powered by 


2
downloads
downloads
Tags:
More
Credit Photo
If you would like to credit the Photo, here are some ways you can do so
Text Link
photo Link
<span class="text-link">
<span>
<a target="_blank" href=https://pikwizard.com/photo/abstract-stock-market-data-with-fluctuating-graphs/8698aa4f6704925a359ad7bb0a2c0e2e/>PikWizard</a>
</span>
</span>
<span class="image-link">
<span
style="margin: 0 0 20px 0; display: inline-block; vertical-align: middle; width: 100%;"
>
<a
target="_blank"
href="https://pikwizard.com/photo/abstract-stock-market-data-with-fluctuating-graphs/8698aa4f6704925a359ad7bb0a2c0e2e/"
style="text-decoration: none; font-size: 10px; margin: 0;"
>
<img src="https://pikwizard.com/pw/medium/8698aa4f6704925a359ad7bb0a2c0e2e.jpg" style="margin: 0; width: 100%;" alt="" />
<p style="font-size: 12px; margin: 0;">PikWizard</p>
</a>
</span>
</span>
Free (free of charge)
Free for personal and commercial use.
Author: Awesome Content
Similar Free Stock Images

Premium


Premium


Premium


Premium


Premium


Premium


Premium


Premium


Premium


Premium


Premium


Premium


Premium


Premium


Premium


Premium


Premium


Premium


Premium


Premium


Premium


Premium


Premium


Premium