- Home >
- Stock Photos >
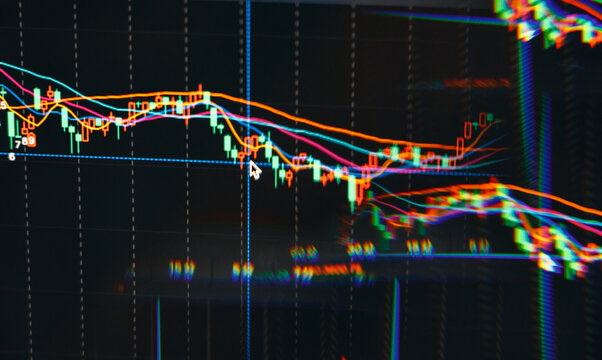
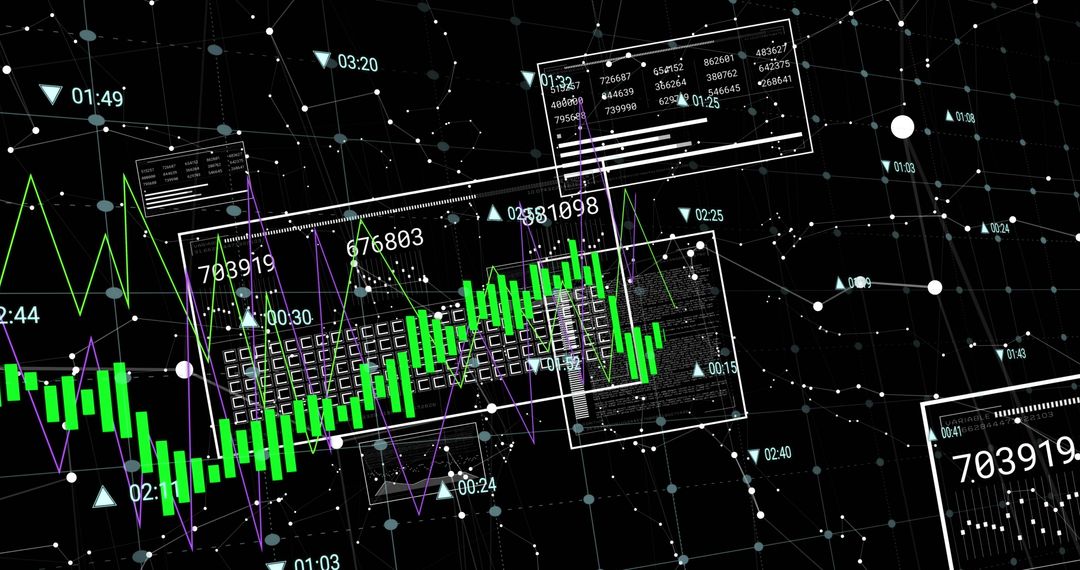
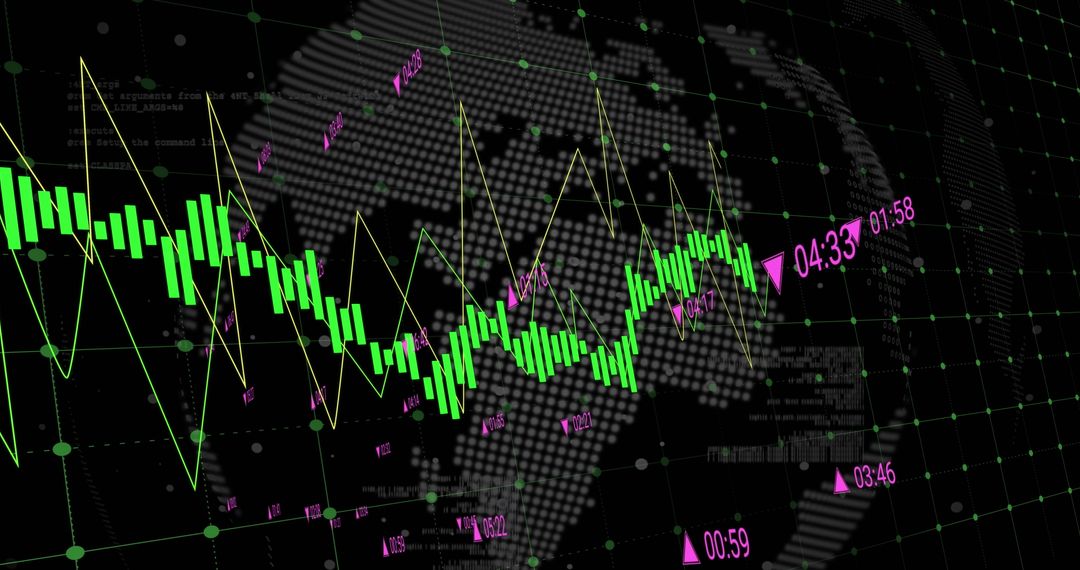
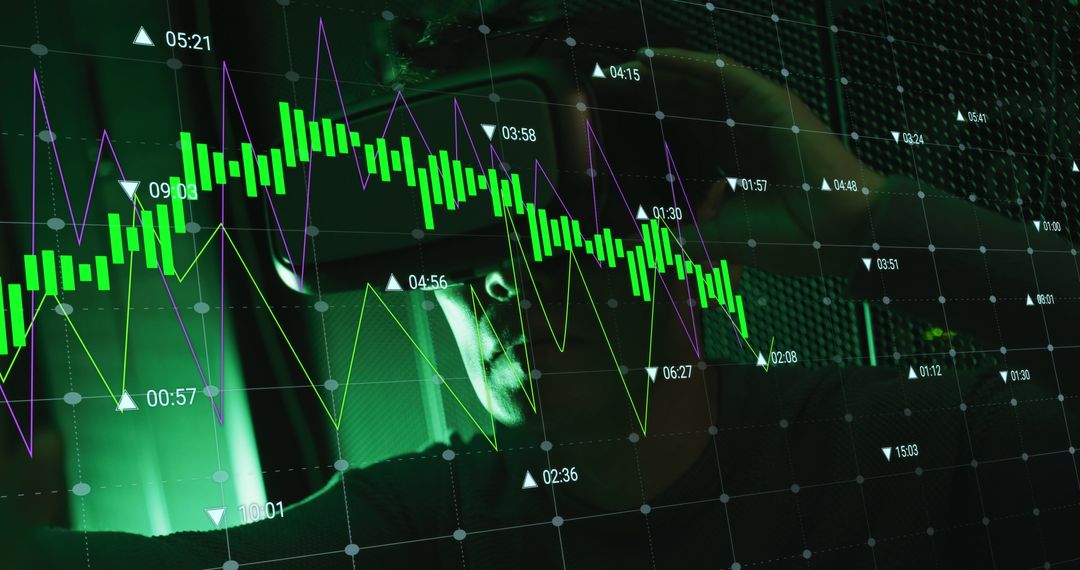
- Abstract Stock Market Graph with Digital Data Animation
Abstract Stock Market Graph with Digital Data Animation Image

Illustrates dynamic fluctuations in financial markets using green graphs against digital data. Represents data processing over networks, making it ideal for financial blogs, market analysis articles, or presentations about trading trends and economic forecasts.
Powered by 


2
downloads
downloads
Tags:
More
Credit Photo
If you would like to credit the Photo, here are some ways you can do so
Text Link
photo Link
<span class="text-link">
<span>
<a target="_blank" href=https://pikwizard.com/photo/abstract-stock-market-graph-with-digital-data-animation/37fb9cec82b3e35cd1d546167ee4a3d7/>PikWizard</a>
</span>
</span>
<span class="image-link">
<span
style="margin: 0 0 20px 0; display: inline-block; vertical-align: middle; width: 100%;"
>
<a
target="_blank"
href="https://pikwizard.com/photo/abstract-stock-market-graph-with-digital-data-animation/37fb9cec82b3e35cd1d546167ee4a3d7/"
style="text-decoration: none; font-size: 10px; margin: 0;"
>
<img src="https://pikwizard.com/pw/medium/37fb9cec82b3e35cd1d546167ee4a3d7.jpg" style="margin: 0; width: 100%;" alt="" />
<p style="font-size: 12px; margin: 0;">PikWizard</p>
</a>
</span>
</span>
Free (free of charge)
Free for personal and commercial use.
Author: People Creations
Similar Free Stock Images

Premium


Premium


Premium


Premium


Premium


Premium


Premium


Premium


Premium


Premium


Premium


Premium


Premium


Premium


Premium


Premium


Premium


Premium


Premium


Premium


Premium


Premium


Premium


Premium