1. Home > 
  2. Stock Photos > 
  3. Abstract Technology with Financial Data and Graphs on Black Background

Abstract Technology with Financial Data and Graphs on Black Background Image

Abstract Technology with Financial Data and Graphs on Black Background

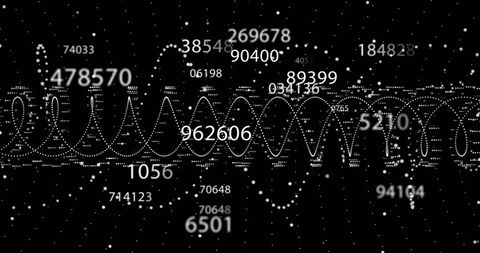
Abstract visualization of financial data combines technology elements and numbers displayed against dark background. Suited for technology overviews, finance presentations, or modern digital interfaces illustrating intricate data analytics.

Powered by Adobe logo
3D abstract financial bar chart with glowing data visualization on blue background - Powered by AdobeAbstract data visualization - Powered by AdobeAbstract digital stock market chart with glowing blue lines and bokeh effects representing financial growth and analysis. - Powered by Adobea world map made of glowing lines and nodes, floating in space, connected cities and data streams, powerful and futuristic, ideal for global brand ads, cinematic 16:9 - Powered by Adobe
Dynamic blue and green digital stock market graph with bar charts and lines on a dark background, representing financial data analysis, investment trends, business growth, and global economy fluctuat - Powered by Adobe

Credit Photo

If you would like to credit the Photo, here are some ways you can do so

Free (free of charge)

Free for personal and commercial use.

Author: People Creations

Similar Free Stock Images

Digital Green Economy Data Visualization with Floating Numbers
Premium
Data center servers with cityscape view. Financial graph and dashboard interface over blur city. Global business and technology internet connection.
Digital Network Pattern Over Black Background
Financial Data Flow against Urban Skyline Backdrop
Abstract Financial Graph Illustration on Dark Background
Digital Interface Showing Global Business Data Analytics
Premium
Dollar Sign Amidst Financial Charts A Symbol of Economic Trends and Markets
Dynamic Flow of Stock Market Data with Floating Numbers
Futuristic DNA Helix with Digital Lightning and Neon Grid Overlay
Abstract Digital Interface with Network Connections and Data Visualizations
Futuristic Digital Network Interface With Interactive Wave Patterns
Premium
Digital financial chart with glowing bars and market data visualization in blue and orange neon colors. Business analytics dashboard. Technology background for finance presentation
Futuristic Digital Data Visualization on Blue Background
Digital Financial Data Processing with Glowing Indicators
Data Analysis with Advanced Technology Interface Details Profusion
Digital Data Stream and Holographic Analysis Visualization
Premium
Business goal setting and strategic planning. professional analyzing financial reports and business analytics, with a glowing target and performance tracking in corporate strategy
Digital Simulated Global Financial Data and Graphs
Financial Data Processing Visualization with Green Digital Grid
Data Visualization on Security Shield Interface for Cyber Security
Data Analysis Graphics on Digital Grid Background
Premium
Golden coin stacks on a reflective surface against a glowing blue digital stock market graph. Business finance, investment, and economic growth concept with abstract bokeh background.
Cityscape with Digital Stock Market Graphs and Statistics
Upward Stock Market Arrow with Binary Code Background
Glowing Financial Graph with World Map in Dark Background
Abstract Digital Data Graph and Diagrams on Gray Background
Premium
Stock market analysis financial graph and city skyline concept
Abstract Digital Interface with Dynamic Shapes on Gray Background
Futuristic Waveform Data Visualization on Digital Grid
Digital Waves and Data Connections in Futuristic Network Display
Futuristic Glowing Waveform in Dark Virtual Space
Digital Graph Representation with Floating Data Points on Black Background
Financial Data Overlay on Cityscape Visualizing Market Trends
Premium
A financial graph is displayed over a modern building with a cityscape backdrop during sunset.
Colorful Bar Graph on Dark Background Illustrates Data Trends
Digital Representation of DNA Strand and Data Processing
Data Analytics and Financial Growth Indicators
Spinning DNA Strand Over World Map with Data Visualization
Premium
Futuristic digital visualization of financial growth and stock market analysis, depicting big data flow across a technology network
Futuristic Graph with Digital Globe Symbolizing Global Technology Connections
Digital Data Network with Dynamic Connections
Abstract Financial Graphs on Dynamic Digital Interface
European Market Data Overlay with EU Flag and Financial Graphs
Premium
Futuristic blue digital waves flowing across a virtual landscape, representing artificial intelligence, data analysis, and modern technology innovations.
Abstract Digital Financial Data Chart with Pink Line Oscillations
Abstract Data Patterns on Black Background Technology Concept
Abstract Data Waveform with Digital Elements Background
Colorful Bar Graph with Data Overlay on Black Background
Premium
Futuristic stock market or trading graph suitable for financial investments economic trends and business ideas Abstract finance background
Digital Graph with Rising and Falling Lines on Grid Background
Digital Data Flow with Infographics Hologram
Financial Data Analysis Vibrant Graphs on Blue Background
Dynamic Financial Data Processing in Green Sphere
Premium
Financial market data analysis with glowing 3D bar and line charts on dark background showing economic trends and growth concept visualization. 3D Rendering
Binary Code Data Over Financial Graph with Red Trends
Dynamic Data Graphs Display on Dark Digital Background
Abstract Representation of Financial Data Processing
Digital Data Processing with Floating Point Graphics
Premium
Digital globe with financial data and currency symbols image
Financial Analysis Concept with Modern Chart Display
Digital Finance Dashboard Showing Candlestick and Line Charts
Neon DNA Strand Overlapping Financial Data Analytics
Abstract Financial Chart Technology Interface
Digital Financial Data Overlaying City Skyline at Dusk
Colorful Digital Waveform Represents Global Connections
Premium
futuristic glowing blue arrows upward on digital background for web design tech branding business growth data concept abstract graphic illustration
Futuristic Digital Interface with Spiraling Coding Patterns
Futuristic Global Business Data with Digital Interface
Financial Graph and Waves Representing Market Trends and Data
Digital Data Visualization with Blue Grid and Timeline
Premium
Data visualization, financial trends and stock market analysis with dynamic graphs and digital technology on screen for investment strategies and forecasting.
Analyzing Data Trends on Digital Graph Interface
Financial Data Processing with Digital Patterns for Global Business
Data Analysis in COVID-19 Medical Research with Molecular Visuals
Dynamic Financial Data Visualizations on Grid Interface
Premium
Abstract financial data visualization
Dynamic Colorful Waves on Black Digital Background
Colorful Data Visualization on Dark Background
Rising Graph Line on Digital Green Grid Background
Digital Financial Data Visual Representation on Blue Background
Premium
Retail store displaying futuristic data analytics interface
Abstract Data Visualization on Blue Background for Technology Concept
Financial Data Analysis with Abstract Chart Grid Overlay
Analyzing Financial Data on Digital World Map Background
Line Graph Illustrating Data Trend on Green Digital Background
Premium
Global network and digital connection: A businessman's hand holds a glowing holographic globe above a laptop, surrounded by abstract digital waves and data points representing worldwide communication.
Digital Wave Patterns on Black Background
Financial Data with Molecular Background Concept
Global Financial Data Analysis with Green Growth Arrows on Blue Background
Futuristic Digital Analytics Chart with Code Overlay
Premium
Digital glowing stock market chart with options trend and index data on a dark background, symbolizing economic growth, trading, and financial technology.
Dynamic Digital Stock Market Analysis Chart Visual
Futuristic Digital Interface with Rotating Elements and Waveform
Graph Lines Portraying Financial Data Trends
Abstract DNA Helix Digital Network
Abstract Sound Waves on Dark Background
Abstract Financial Graph with Bar and Line Charts on Dark Background
Premium
Green arrow pointing upward on financial graph. Business growth chart with rising trend line. Digital stock market data visualization for investment analysis
Futuristic Data Processing Animation with Media Icons
Fluctuating Digital Stock Market Data Chart
Digital Data Analysis with Green Line Graph on Grid Background
Data Trends and Analysis on 3D Digital Grid
Premium
Businessman working with modern computer virtual dashboard analyzing finance sales data and economic growth graph chart and block chain technology.
Futuristic Financial Data Visualization on Digital Interface
Global Finance and COVID-19 Impact Representation
Digital Graph Representing Data Analysis and Technology
Dynamic Financial Data Analysis in Digital Interface
Premium
A mans silhouette with financial data overlay isolated on transparent background
Digital Fingerprint with Data Analytics in Cybersecurity Context
Dynamic Financial Data Visualization on Digital Grid Background
Dynamic Green Line Graph Depicting Financial Data
Dynamic Energy Particle Wave Concept on Metallic Gray Background
Premium
3D abstract financial bar chart with glowing data visualization on blue background
Financial Data Analysis on Blue Digital Interface
Dynamic Financial Graphs Overlaying Modern Cityscape
Green Line Graph with Data Points on Grid Background
Global Financial Data Analysis with Colorful Graphs
Premium
Abstract financial chart with glowing lines and data points
Abstract Digital DNA and Financial Data Interface
Digital Financial Data Graph on Black Screen Background
Abstract Data Visualization with Circular Markers and Numeric Labels
Abstract Digital Network with Binary Sine Wave and Magenta Icons
Premium
Abstract futuristic technology background with glowing lines charts and data visualization
Animating red radar gauge centering holographic data dashboard with 2009 and 2019 timelines