
- Home >
- Stock Photos >
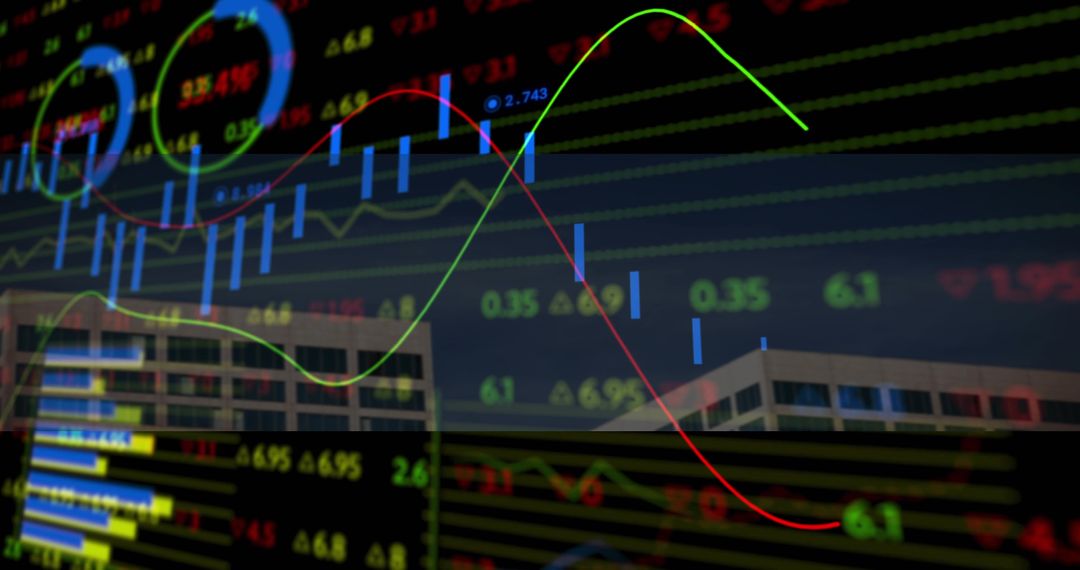
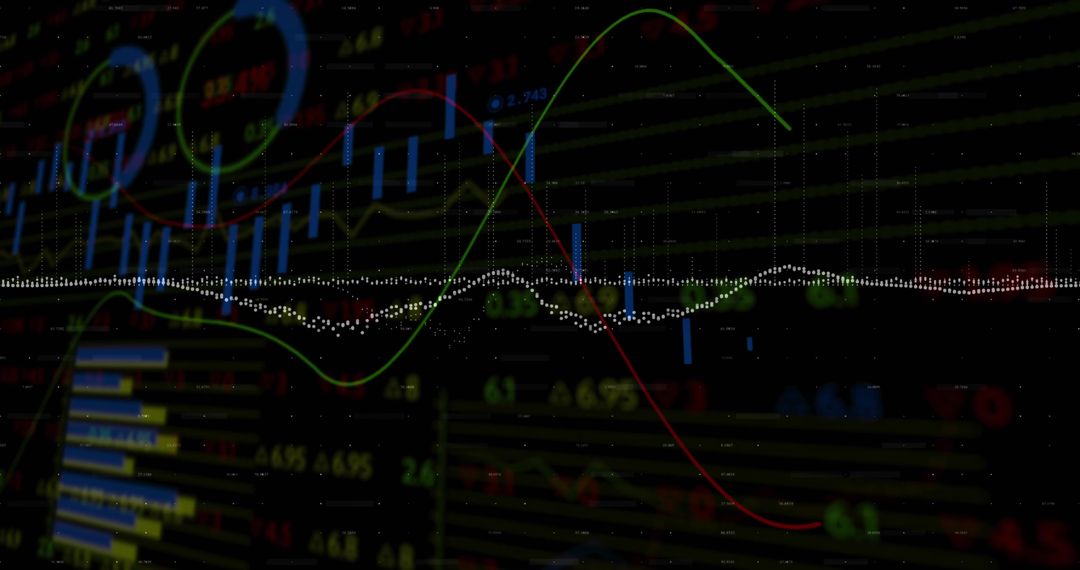
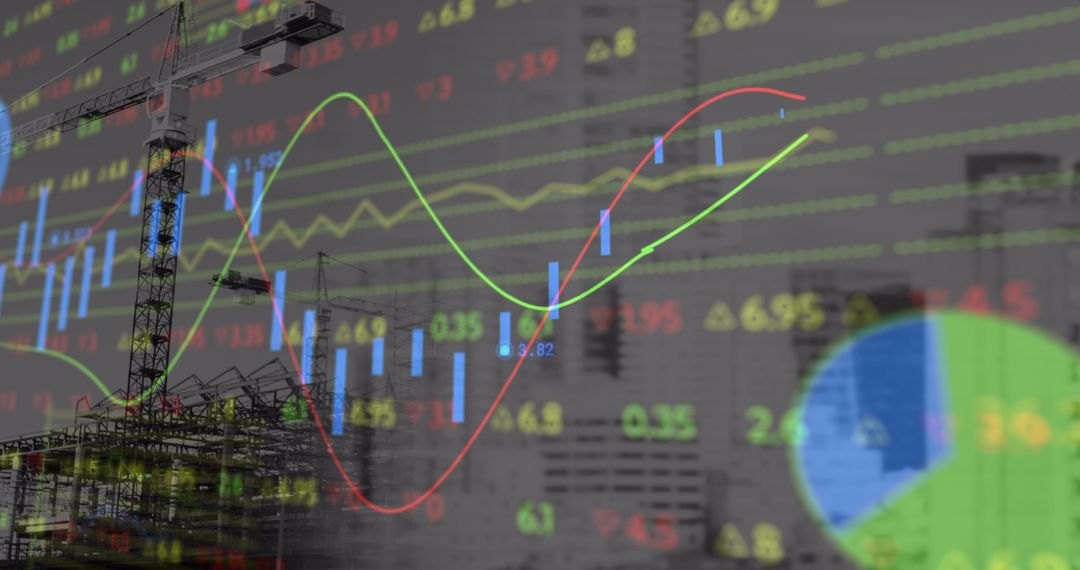
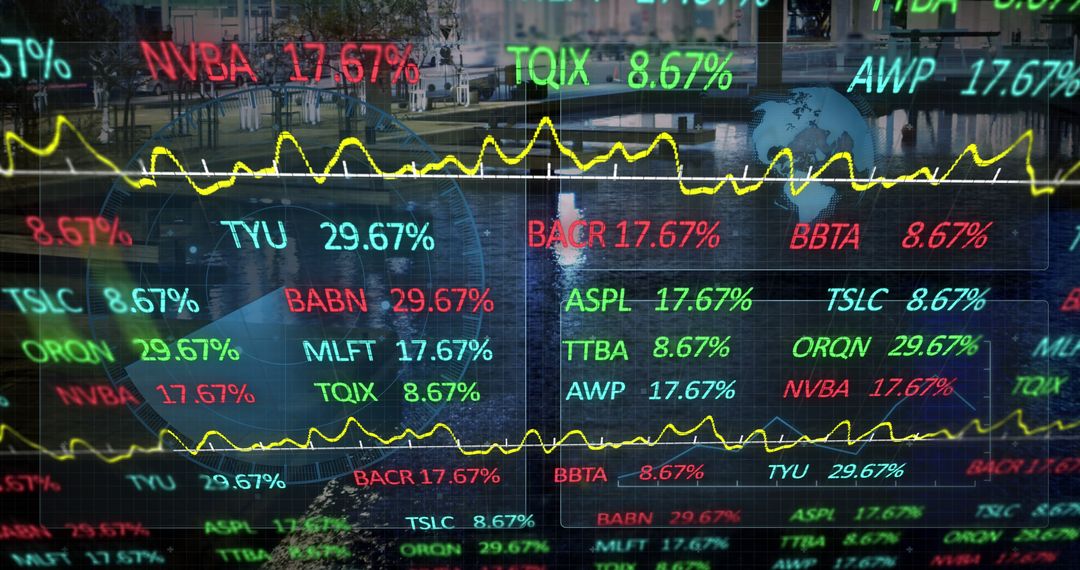
- Abstract trading dashboard showing candlestick chart with neon trend lines and data curves
Abstract trading dashboard showing candlestick chart with neon trend lines and data curves Image
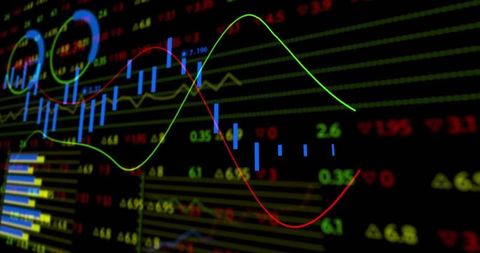
High-contrast trading dashboard featuring blurred dark background, bright neon trend lines in green and red, blue candlestick bars, yellow gridlines and numeric tickers. Visualizing market volatility, momentum and trend analysis for technical trading concepts. Ideal for finance articles, fintech website headers, trading app mockups, investment reports, presentation slides and social media posts about market movements. Working well as hero banner or background for overlaying headlines, charts or UI elements. Offering strong contrast for dark-mode designs and easy color matching for brand palettes. Crop-friendly for widescreen banners and thumbnails and suitable for use in educational materials on technical analysis and algorithmic trading demonstrations.
Powered by  - Get 15% off with code: PIKWIZARD15


0
downloads
downloads
Tags:
More
Credit Photo
If you would like to credit the Photo, here are some ways you can do so
Text Link
photo Link
<span class="text-link">
<span>
<a target="_blank" href=https://pikwizard.com/photo/abstract-trading-dashboard-showing-candlestick-chart-with-neon-trend-lines-and-data-curves/437dbb2faa287f84fe6efaf4b196f0c0/>PikWizard</a>
</span>
</span>
<span class="image-link">
<span
style="margin: 0 0 20px 0; display: inline-block; vertical-align: middle; width: 100%;"
>
<a
target="_blank"
href="https://pikwizard.com/photo/abstract-trading-dashboard-showing-candlestick-chart-with-neon-trend-lines-and-data-curves/437dbb2faa287f84fe6efaf4b196f0c0/"
style="text-decoration: none; font-size: 10px; margin: 0;"
>
<img src="https://pikwizard.com/pw/medium/437dbb2faa287f84fe6efaf4b196f0c0.jpg" style="margin: 0; width: 100%;" alt="" />
<p style="font-size: 12px; margin: 0;">PikWizard</p>
</a>
</span>
</span>
Free (free of charge)
Free for personal and commercial use.
Author: People Creations
Similar Free Stock Images
Premium


Premium


Premium


Premium


Premium


Premium


Premium


Premium


Premium


Premium


Premium


Premium


Premium


Premium


Premium


Premium


Premium


Premium


Premium


Premium


Premium


Premium


Premium


Premium

