1. Home > 
  2. Stock Photos > 
  3. Abstract Triangle Over Financial Data and Graphs

Abstract Triangle Over Financial Data and Graphs Image

Abstract Triangle Over Financial Data and Graphs

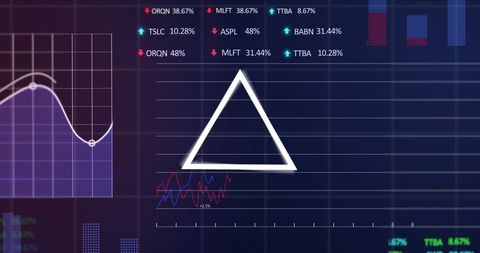
Geometric shape superimposed on financial data and graphs in digital space, suggesting themes of global economy and business analysis. Might be suitable for illustrating financial reports, market trends, investment strategies, stock analysis articles, or educational materials about finances.

Powered by Adobe logo
Golden Geometric Shapes Exploding with Light on Dark Background - Powered by AdobeA stylized abstract illustration with blue geometric shapes representing business growth, a rocket taking off - Powered by AdobeAbstract. Dark. Technology. A dark and subtle abstract background with a glowing green low poly pattern, perfect for a cybersecurity theme, a financial tech presentation, or a modern website header. - Powered by AdobeCreative 2026 new year road map illustration with blue growth arrow and green triangle shapes symbolising start of successful journey and progress - Powered by AdobeGold Horse Sculpture, elegant metallic finish on a red dramatic geometric podium, perfect for luxury branding, financial success, business presentations, and awards concepts - Powered by Adobe

Credit Photo

If you would like to credit the Photo, here are some ways you can do so

Free (free of charge)

Free for personal and commercial use.

Author: People Creations

Similar Free Stock Images

Green Data Graph on Black Digital Interface
Premium
abstract colorful background
Digital Data Visualization with Trend Lines and Percentage Changes
Premium
Dynamic Abstract 3D Shapes and Geometric Flow Background
Premium
Abstract geometric structure on a pedestal
Digital Green Line Graph Over Grid with Statistics and Numbers
Rising Financial Data Graph on Digital Grid Background
Digital Data Processing with Technology Interface on Blue Background
Digital Financial Data and Global Business Analytics
Premium
Modern office building
Rising Graphs and Interactive Financial Data Analytics Background
Rising Graph Line on Digital Green Grid Background
Dynamic Financial Graph with Rising Trend on Blue Background
Optimized Statistical Data Overlain on Corporate Architecture
Premium
Abstract still life of geometric shapes in matte Red, Blue, and Green Lights
Dynamic Red Line Graph With Data Points on Gridded Background
Digital Financial Data and Global Market Analysis on Graph
Dynamic Green Line Graph Depicting Financial Data
Dynamic Stock Market Graphs with Trends and Data Alerts
Premium
A geometric abstract icon on a white background. The image features a green triangle surrounding an implied dollar sign, with an upward arrow
Holographic Financial Data Visualization with Stock Trends
Digital Visualization of Global Networking with Statistical Graphs
European Market Data Overlay with EU Flag and Financial Graphs
Dynamic Financial Graph with Candlestick Patterns and Percentage Metrics
Digital Financial Data Processing Interface on Red Background
Financial Data Flow against Urban Skyline Backdrop
Futuristic Multi-Series Data Visualization Dashboard Chart
Digital Financial Data Analysis with Graphs and Stock Market Trends
Digital Data Processing Interface with Green Growth Chart
Financial Data Analysis Overlaid on Warning Sign
Premium
Modern city skyline with geometric shapes and bright light
Digital Financial Data Analysis with Infographics and Charts
Dynamic Financial Growth Digital Chart Display
Financial Data Charts with World Map on Blue Digital Background
Digital Financial Data with Graph and Grid Patterns
Digital Finance: Modern Stock Market Analysis Display
Digital Stock Market Trends and Financial Growth Analysis
Premium
Hand placing orange triangle block with 1.5 on top of wooden blocks
Cityscape with Digital Stock Market Graphs and Statistics
Futuristic Financial Data Analysis with Rising White Line Graph
Dynamic Green Line Graph Showing Financial Data Fluctuations
Digital Data Analysis with Green Line Graph on Grid Background
Holographic Financial Stock Market Analysis Visualization
Financial Data Analysis with Interactive Graphs
Green Line Graph on Dark Digital Grid
Dynamic Financial Data Against Urban Skyline
Fluctuating Financial Graph with Red Line on Green Grid
Premium
Modern triangular architecture in Riyadh, focusing on structural innovation and urban development, World Architecture Day
Financial Data Processing with Rising Graphs
Financial Data Line Graph on Digital Display
Futuristic Analytics Graph with Cyan-Orange Line Trends
Digital Chart Display Financial Data Analysis Background Effects
Financial Stock Market Data Analysis on Digital Interface
Dynamic Financial Data Display in Digital Space
Rising Digital Graph and Data Visualizations on Black Background
Futuristic Keyboard Analytics Display with Digital Graphs and Numbers
Premium
Green Triangle Mosaic.
Financial Graph and Cityscape Analysis with Technological Overlay
Data Security with Tech Bar Graph Overlay
Dynamic Data Chart on Dark Digital Background
Dynamic Financial Data Overlaid on Grid Background
Premium
Modern Geometric Blue and Grey Hexagonal Financial Logo Vector Design Isolated
Digital Stock Market Graph Red Trendline on Green Background
Fluctuating Stock Market Graph with Dramatic Peaks
Dynamic Financial Data Visualization on Digital Grid Background
Premium
Glowing arrow composed of layered digital data triangles – Ideal for business growth, data visualization, or futuristic progress themes.
Digital Stock Market Green Graph Against Dark Trading Board
Dynamic Line Chart with Histogram on Digital Grid Background
Data Analytics Graphs on Digital Interface Background
Digital Financial Data Overlay on Urban Street Scene
Premium
Blue room with diamond and colored beams and profit text
Premium
Sharp neon triangles with glowing edges futuristic digital cyber inspired abstract background
Neon Holographic Trading Dashboard with Dual-Line Charts, Global Map and Percent Tickers
Abstract Financial Data Processing and Analysis Interface
Financial Graph with Data Analysis and Market Statistics
Data Analytics and Financial Growth Indicators
Premium
Modern Glass Skyscraper with Reflections Low Angle Against Sky at Sunset, Clouds Below, Geometric Triangular Architecture, Contemporary Building Exterior
Dynamic Financial Graphs Illustrating Market Trends
Fluctuating Digital Stock Market Data Chart
Abstract Digital Stock Market Analysis with Graphs
Dynamic Financial Data Visualization over Urban Silhouette
Premium
Growth arrow with steps and geometric shapes
Financial Data Visualization with Declining Red Arrow
Dynamic Financial Stock Market Analysis Display
Dynamic Digital Data Analysis on Elevated Grid
Premium
Abstract black and blue geometric paper texture background with angular triangle shapes and fine lines, modern corporate design for business branding, professional presentations, marketing cards, flye
Premium
Dark blue geometric pattern with golden lines and triangles
Dynamic Financial Charts and Graphs Indicating Market Trends
Financial Growth Graph and Data Analytics Representation
Green Financial Line Graph with Candlestick Data on Grid Background
Premium
Hands holding a red warning symbol in front of a chart, signaling risk, alert, and crisis in financial data
Global Analytics Dashboard with Zigzag Chart on Dark Interface
Futuristic Graph and Data Visualization Interface Design
Cryptocurrency Trends and Data Visualization Concept
Dynamic Business Data and Cityscape Visualization
Abstract Triangular Shape over Stock Market Data Visualization
Fluctuating Financial Graph on Green Grid Background
Dynamic Financial Data Analysis with Growth Indicators
Financial Data Analysis Vibrant Graphs on Blue Background
Dynamic Financial Graphs Overlaying Modern Cityscape
Red Line Chart Trending Downward in Data Visualization
Innovative Data Analysis with Dynamic Line Graph and Digital Elements
Red Declining Graph on Digital Grid Display Represents Falling Markets
Dynamic Financial Data on Dark Background With Colorful Graphs
Dynamic Financial Chart with Red Line Graph on Digital Interface
Premium
Abstract graphic with colorful triangles and lines, overlaid on a dark background
Premium
Two colorful euro symbols, a mosaic design
Financial Data Graph Rendering Global Market Trends
Financial Data Visualization with Cityscape Overlay
Holographic Financial Graph with Dynamic Line Chart
Green Financial Line Chart Over Modern Office Buildings
Premium
Blue White Triangle Geometric Pattern.
Abstract Digital Charts with Social Media Metrics Rising
Green Line Graph with Data Points on Grid Background
Rising Stock Market Trends and Chart Analysis
Premium
Modern geometric background with blue and white triangles
Dynamic Data Visualization with Financial Charts and 3D Elements
Digital Data Visualization and Analysis Interface
Abstract Financial Data Visualization with Graphs and Grid Background
Financial Data Analysis in Digital Interface with Graphs
Premium
Red triangle teal arrows golden coins capital flow wealth accumulation investment concept financial growth economic influx money funnel abstract finance
Economic and Political Factors Influence Investment Trends
Premium
Futuristic arrow of layered blue-white glowing data triangles – Perfect for speed, precision, or high-tech digital interface design.
Analyzing Data Trends on Digital Graph Interface
Financial Data Graph Over Cityscape with Digital Overlay
Explore More Free Stock Images