1. Home > 
  2. Stock Photos > 
  3. Abstract Visualization of Data Analytics Dashboard with Speech Bubbles

Abstract Visualization of Data Analytics Dashboard with Speech Bubbles Image

Abstract Visualization of Data Analytics Dashboard with Speech Bubbles

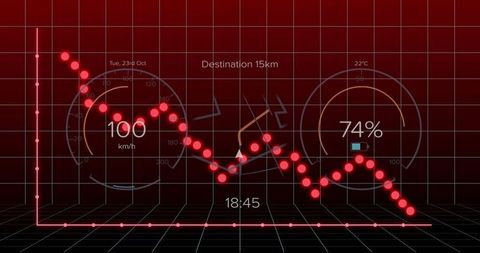
This abstract visualization displays an analytics dashboard with floating avatar icon, charts, speech bubbles, and percentage labels. Designed to represent data analysis and business intelligence, it is ideal for use in technology presentations, stock market analysis, digital marketing material, and educational content on handling data. Its engaging visuals effectively convey complex information in a simplified format, suitable for infographics or thematic uses across sectors.

Powered by Adobe logo
Close-up of a digital display showing various charts and graphs in blue and orange hues, representing data analysis and business intelligence, ideal for technology or financial concepts - Powered by AdobeModern dashboard real time data tax compliance analytics business intelligence financial report digital interface technology office professional workspace - Powered by AdobeAI analytics background, big data visualization, machine-learning insights, cyber data intelligence, digital processing flow, global data network, predictive analytics, neural data visualization. - Powered by AdobeFlowing abstract digital landscape in green and gold tones, data wave visualization ideal for AI concepts, analytics dashboards, music tech and futuristic storytelling. - Powered by AdobeBusinessman Using Smartphone with Digital Twin Data Visualization in Modern Warehouse Storage - Powered by Adobe

Credit Photo

If you would like to credit the Photo, here are some ways you can do so

Free (free of charge)

Free for personal and commercial use.

Author: Authentic Images

Similar Free Stock Images

Futuristic Digital Representation of DNA Strand
Premium
Holographic business dashboard displaying pie chart and bar graph with futuristic blue and orange data visualization
Colorful Digital ECG Heartbeat Graphs on Black Background
Digital Financial Data with Graph and Grid Patterns
Premium
Business data analytics performance evaluation dashboard royalty free image premium quality
Neon AI Data Visualization Dashboard Displaying Neural-Tree Line Chart with Nodes
Dynamic Stock Market Graphs and Financial Data
Digital Financial Data Graph Showcasing Market Trends
Data Analytics Graphs on Digital Interface Background
Premium
Female Sustainability Consultant Presenting ESG Performance Metrics
Dynamic Financial Data Chart Showing Trend Analysis
Innovative Data Analysis with Dynamic Line Graph and Digital Elements
Digital Financial Data and Graphs Against World Map Background
Neon Soccer Field Overlaying Financial Dashboard Showing Red and Blue Performance Trends
Premium
Digital business analytics dashboard with glowing holographic charts, graphs and data visualization icons floating above modern office desk for corporate strategy.
Futuristic Data Visualization Graph Vector Rising Trend
Financial Data Graph Rendering Global Market Trends
Dynamic Blockchain Data Chart with Financial Trends Background
City Skyline with Overlay of Financial Market Trends
Premium
Man works on multiple computer monitors in dark tech office. Screens display global maps with colorful data visualizations, charts, graphs. Analyzes geographic info, big data, performing advanced
Abstract Financial Graph with Rising Waves on Red Gradient
Financial Stock Market Data Visualization with Declining Trends
Premium
Close up of faceless hand using stylus pen to interact with carbon dioxide emissions dashboard hologram displaying eco data analytics cloud icon visualization environmental
Dynamic Financial Graphs Overlaying Urban Skyline
Dynamic Financial Charts and Graphs Indicating Market Trends
Digital Financial Data Overlaying City Skyline at Dusk
Abstract Finance Graph Over 3D Cityscape Background
Advanced Financial Charting with Zigzag Indicator and Trends
Futuristic Digital Graph Showing Data Trends on Analytic Interface
Abstract Representation of Financial Data Processing
Graph Lines Portraying Financial Data Trends
Futuristic Data Dashboard with Graph and Code Overlay
Dynamic Financial Data Visualization on Digital Grid Background
Cybersecurity Data Terminal with Digital Waveform
Digital Data Visualization with Trend Lines and Percentage Changes
City Skyline with Overlaid Transparent Business Line Graph
Digital Financial Dashboard with Graphs and Data Visualization
Premium
KPI data analytics concept, Key performance indicator analysis system. Information technology digital software management. Visualization tech solution. Business artificial intelligence. AI dashboard
Premium
A smartphone platform displaying analytics with a miniature digital globe, representing mobile data intelligence and the concept of real time insights for global markets and connected devices.
Premium
Vibrant workspace showcasing data analysis with colorful charts and graphs on a large digital dashboard display
Red Zigzag Graph with Arrow on Green Grid Background
Abstract Financial Graphs on Dynamic Digital Interface
Interactive Digital Analytics Dashboard with Engagement Data
Financial Graph Displayed Over City Skyline at Sunset
Premium
Doctor working on a laptop with layered digital health analytics symbolizes data driven medical insights clinical performance tracking modern healthcare technology and advanced health management
Digital Data Processing with Graph and Grid Technology Interface
Abstract Data Visualization with Technological Grid Background
Displaying pixelated user profile overlaying blue and red trend lines on analytics panel
Futuristic Digital Waveform with Data Icons
Futuristic Growth Hacking Data Analytics Concept
Abstract Digital Charts with Social Media Metrics Rising
Neon Social Media Analytics Line Chart with Engagement Bubbles Showing Likes Comments
Digital Finance Chart Overlaying Globe Background
Data Trends and Analysis on 3D Digital Grid
Rising Digital Graph and Data Visualizations on Black Background
Financial Data Analysis and Digital Interface Concept
Futuristic Visual Analytics of Environmental Data on Neon Grid
Financial Data Flow against Urban Skyline Backdrop
Premium
Multiple screens with colorful data visualizations symbolizing real-time network monitoring, cybersecurity analysis, and threat detection in a secure IT environment
Premium
Displaying visualization in dashboard with interface icons, world map and pink, blue line graphs
Futuristic Data Visualization with Social Media Elements
Abstract Graphs Over Modern Building at Night
Dynamic Business Data and Cityscape Visualization
Futuristic Data Dashboard with Abstract Waveforms and Light Effects
Premium
Hovering wireframe keyboard in purple analytics space, with data sheets and binary sequences
Premium
Sales data analysis dashboard showing performance, trends, and insights. Sales data tracks growth, supports decisions, sales data boosts strategy, and sales data drives performance. Latch
Digital Data Processing with Neon Grid Overlay
Pulsating ECG BioData Over Digital Code Matrix
Financial Graphs Overlaying Shopping Bag Representation Economy
Interactive Social Media Metrics Overlaid on Business Data Graph
Digital Data Processing with Chart in Futuristic Interface
Descending Data Trend Line on Futuristic Digital Dashboard
Candlestick Chart Visualization with Indicators and Growth Highlight
Global Data Analytics Over World Map with Numeric Statistics
Premium
Digital dashboard displaying various data visualizations and metrics for monitoring performance in a high-tech environment.
Financial Dashboard with Line and Bar Graphs for Market Analysis
Futuristic Data Analytics Over Technical Blueprint Design
Statistical Data Processing with Graph Overlay on Buildings
Futuristic Digital Cockpit with Interactive Data Graphs
Premium
Business professional using AI tools on laptop to visualize analytics, optimize data strategy, and improve organizational efficiency in real time
Premium
Marketing Manager Using Laptop
Futuristic Energy Tracking with Rocket Blueprint and Data Analytics
Dynamic Financial Data Visualizations on Grid Interface
Dynamic Line Graph with Digital Engagement Metrics Simulation
Financial Graph Analysis on Green Grid Background
Premium
AI finance business data analysis digital technology investment trading market stock, financial analyst using advanced holographic interface for global market insight, smart investment strategy
Premium
Consultant using AI-powered dashboards for market analysis
Financial Graph and Waves Representing Market Trends and Data
Abstract Financial Data Visualization in Server Room
Fluctuating Line Chart on Analytics Dashboard Interface
Neon Green Data Trend Line Displaying Node Markers on Dark Grid with Waveform Overlays and BI
Premium
Data flow from database and cloud to processing and analytics dashboards, representing data analysis, automation, insight generation, and digital intelligence Latch
Digital Graphs and Data Visualization on Green Background
Dynamic Financial Growth Digital Chart Display
Dynamic Financial Graph on Purple Background
Data Visualization with Line Charts and Cyberspace Interface
Dynamic Financial Graph with Violet Background Concept
Holographic analytics dashboard displaying neon line charts, nodes and red data rings
Financial Data Visualization with Colorful Graphs and Charts Representing Analytics
Dynamic Digital Projection of Market Trends and Equations
Financial Growth Chart Over Ocean with Green Grid Overlay
Dynamic Financial Graphs Overlaying Modern Cityscape
Futuristic Financial Data Analysis in Digital Environment
Rising Financial Data Graph on Digital Grid Background
Premium
Global financial trading chart with glowing blue bars and world map on digital interface background illustrating business data and economy concept. Ai generative
Cityscape with Digital Stock Market Graphs and Statistics
Data Recovery Progress Display on Digital Interface
Digital Financial Data and AI Illustration Networking Globally
Digital Financial Graphs Over 3D City Model Illustration
Premium
Interactive data visualization dashboard, Digital business analytics platform, Financial performance monitoring software, Real time reporting interface
Optimized Statistical Data Overlain on Corporate Architecture
Dynamic Financial Data Analytics with Interactive Visual Elements
Abstract Financial Data Analysis with White and Green Lines
Dynamic Financial Data Displays Stock Market Trends
Premium
Digital checklist interface with data analytics and task complet
Dynamic Digital Data Analysis on Elevated Grid
Neon Round Scanner with Statistical Data Display
European Market Data Overlay with EU Flag and Financial Graphs
Financial Graphs Overlaying Industrial Junkyard
Premium
Close up of a person s hands holding a smartphone displaying a complex data visualization app
Abstract Digital Finance Chart Showing Fluctuating Graph Lines
Dynamic Financial Data Overlaid on Grid Background
Digital Stock Market Graph Red Trendline on Green Background
Abstract Financial Graph with Glowing Node on Grid Background
Premium
KPI analytics dashboard showing charts, performance metrics, AI insights and task checklists used by man on tablet for business data analysis, digital strategy planning and productivity management
Explore More Free Stock Images