- Home >
- Stock Photos >
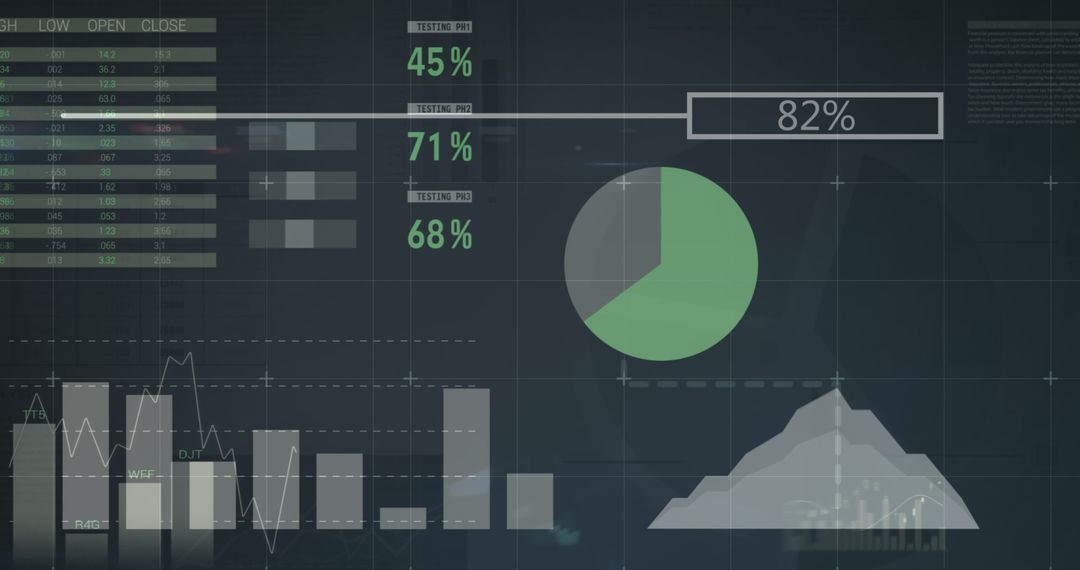
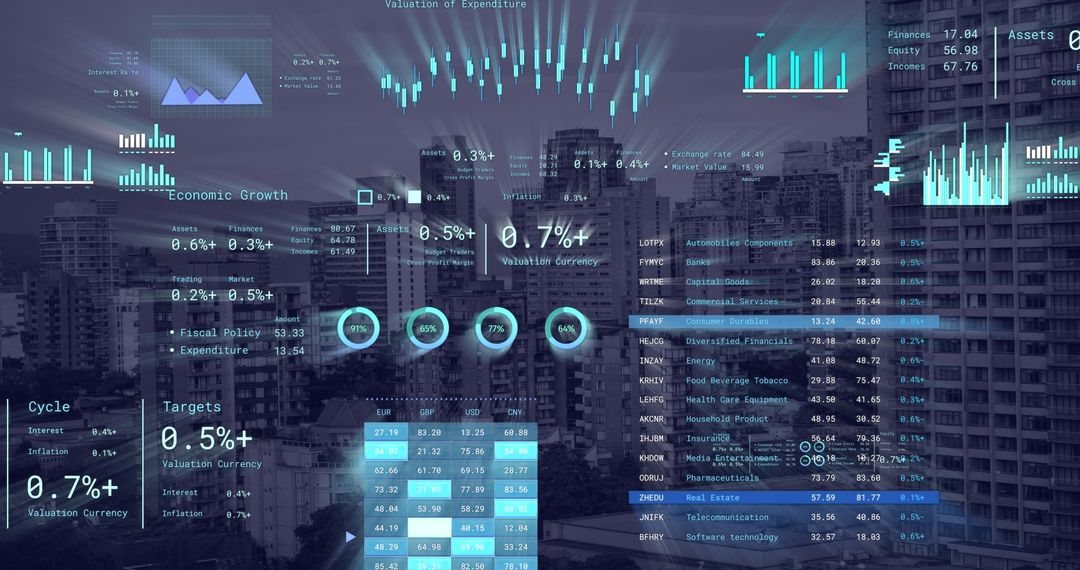
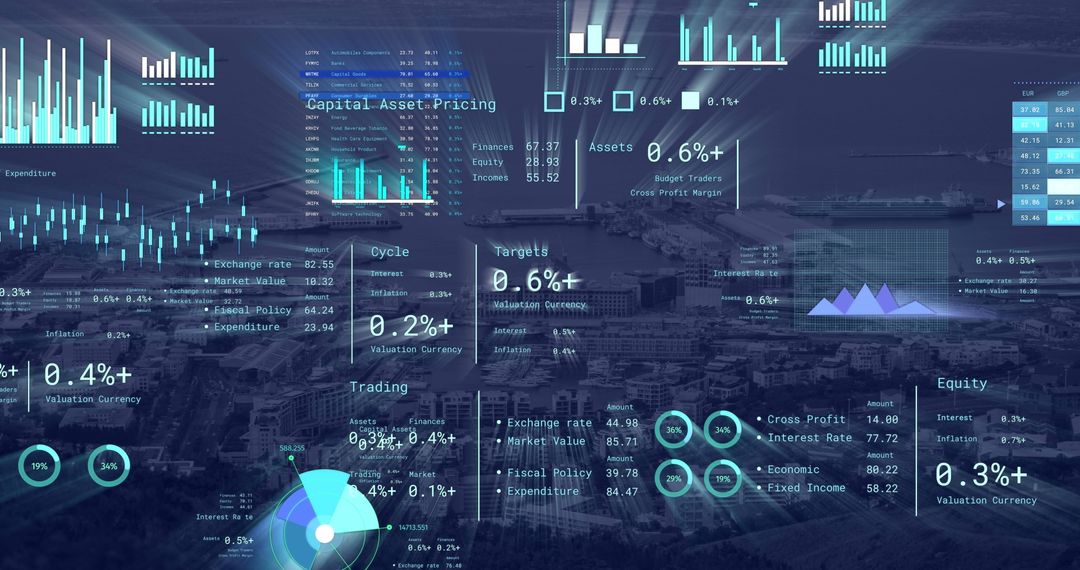
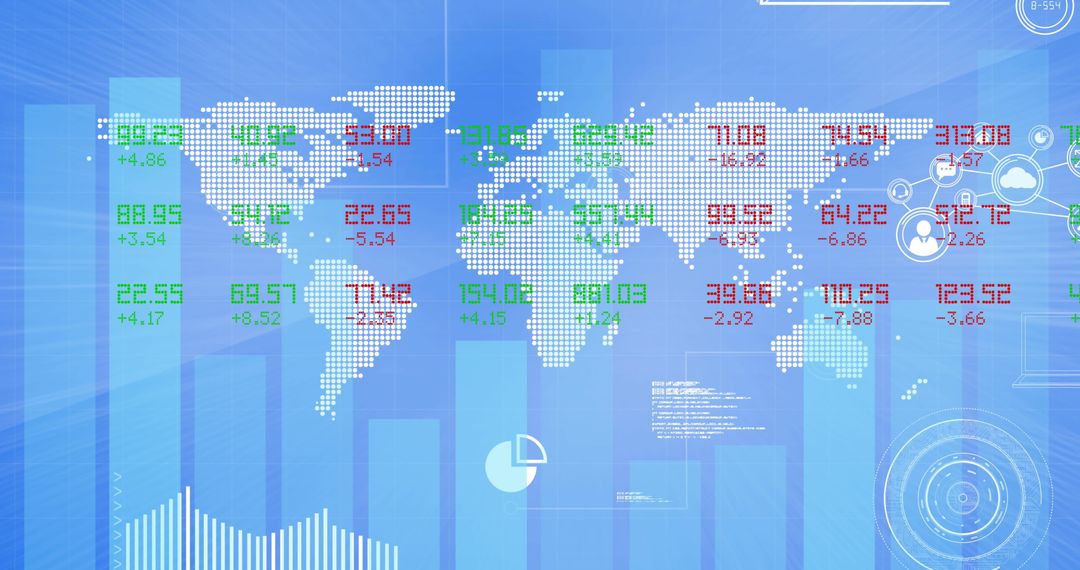
- Abstract Visualization of Financial Data and Digital Analysis
Abstract Visualization of Financial Data and Digital Analysis Image

Digital depiction of financial data overlaying abstract elements. Ideal for illustrating concepts related to finance, stock market analysis, data processing, or information technology in a modern or futuristic context.
Powered by  - Get 15% off with code: PIKWIZARD15


2
downloads
downloads
Tags:
More
Credit Photo
If you would like to credit the Photo, here are some ways you can do so
Text Link
photo Link
<span class="text-link">
<span>
<a target="_blank" href=https://pikwizard.com/photo/abstract-visualization-of-financial-data-and-digital-analysis/e89f827527c7d7b1bf4ca34d1fe77048/>PikWizard</a>
</span>
</span>
<span class="image-link">
<span
style="margin: 0 0 20px 0; display: inline-block; vertical-align: middle; width: 100%;"
>
<a
target="_blank"
href="https://pikwizard.com/photo/abstract-visualization-of-financial-data-and-digital-analysis/e89f827527c7d7b1bf4ca34d1fe77048/"
style="text-decoration: none; font-size: 10px; margin: 0;"
>
<img src="https://pikwizard.com/pw/medium/e89f827527c7d7b1bf4ca34d1fe77048.jpg" style="margin: 0; width: 100%;" alt="" />
<p style="font-size: 12px; margin: 0;">PikWizard</p>
</a>
</span>
</span>
Free (free of charge)
Free for personal and commercial use.
Author: People Creations
Similar Free Stock Images

Premium


Premium


Premium


Premium


Premium


Premium


Premium


Premium


Premium


Premium


Premium


Premium


Premium


Premium


Premium


Premium


Premium


Premium


Premium


Premium


Premium


Premium


Premium


Premium