- Home >
- Stock Photos >
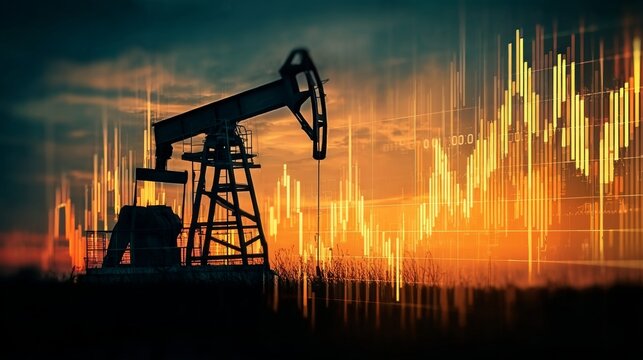
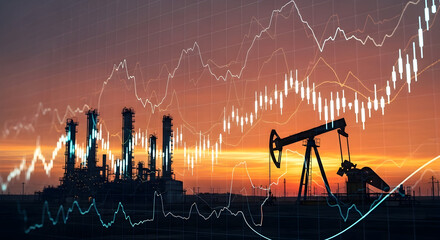
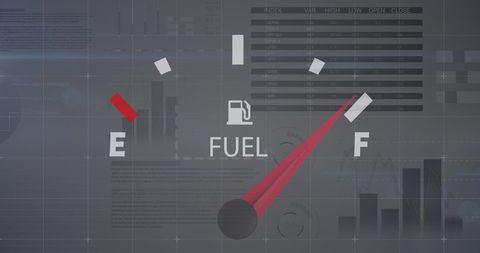
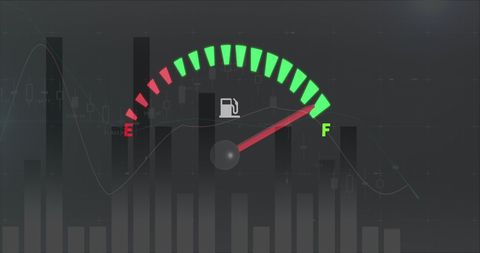
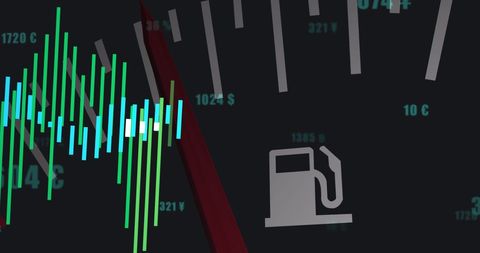
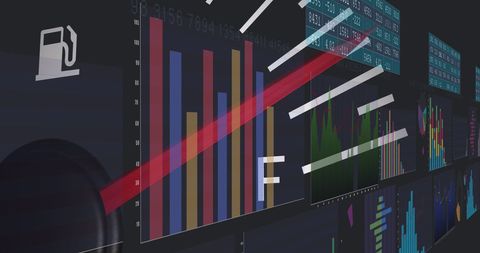
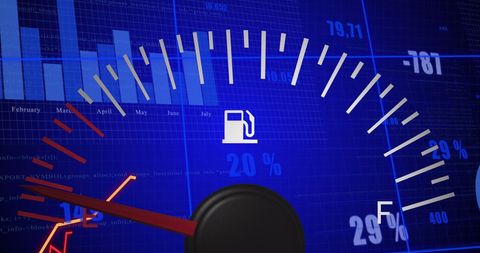
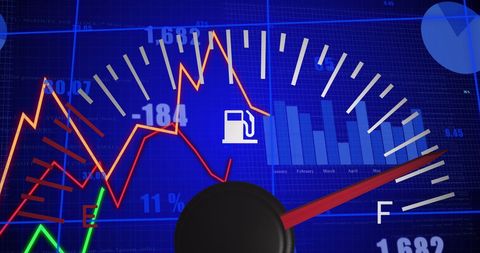
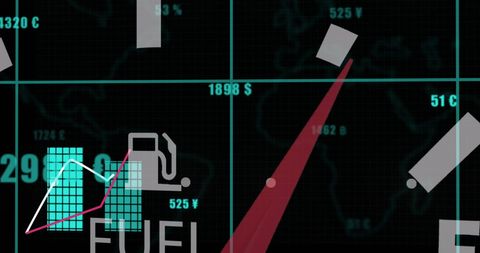
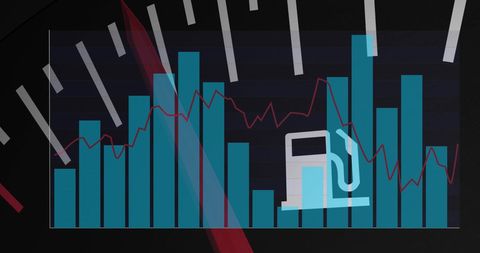
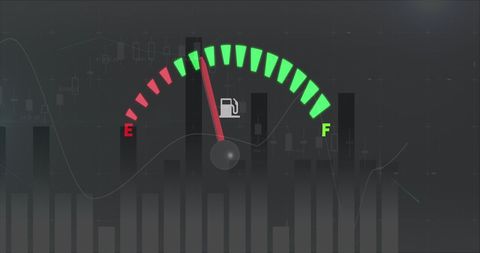
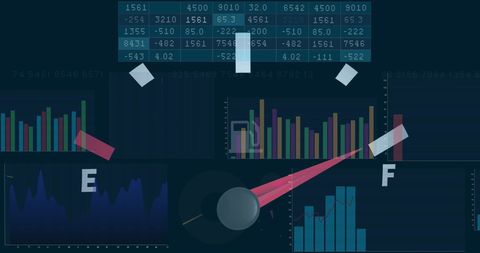
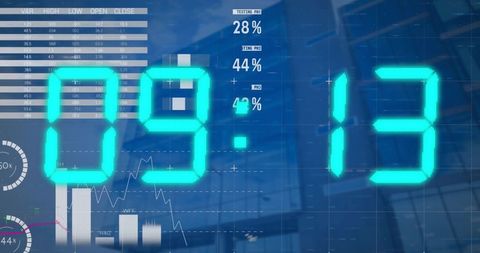
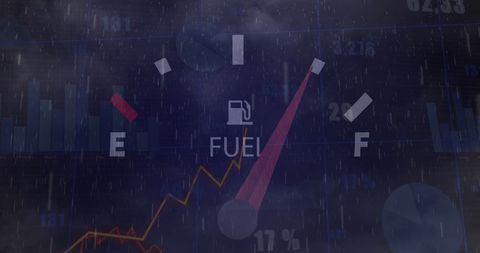
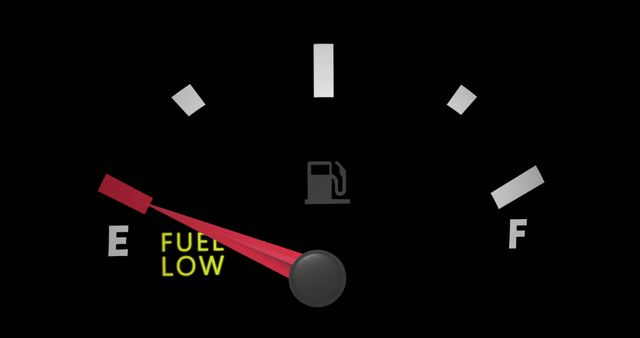
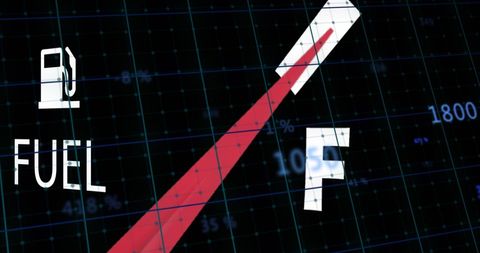
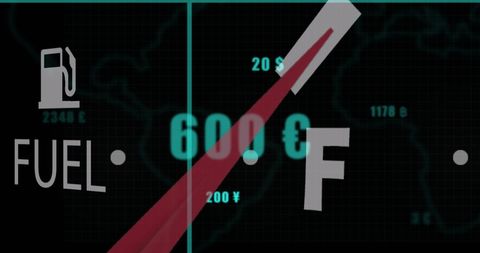
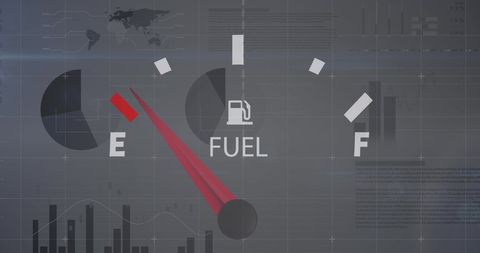
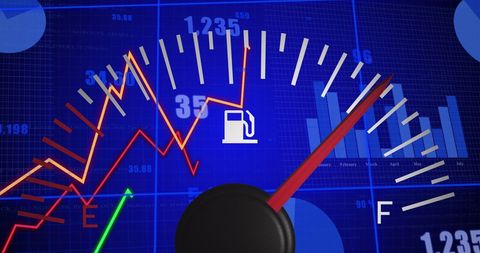
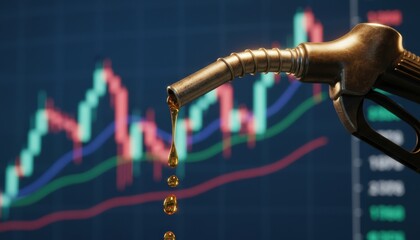
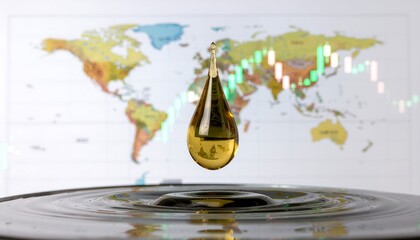
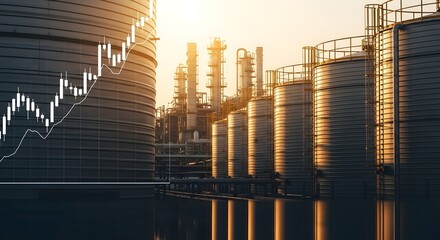
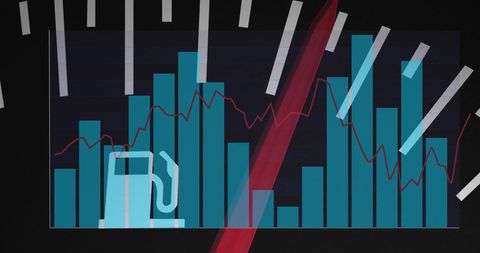
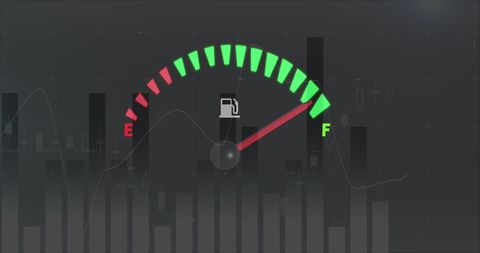
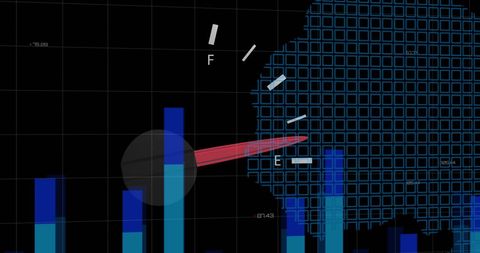
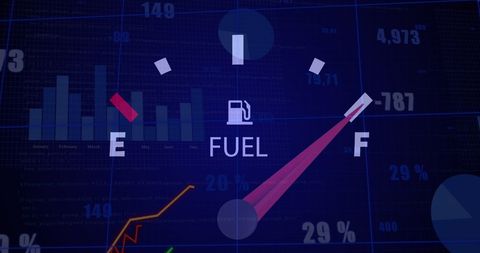
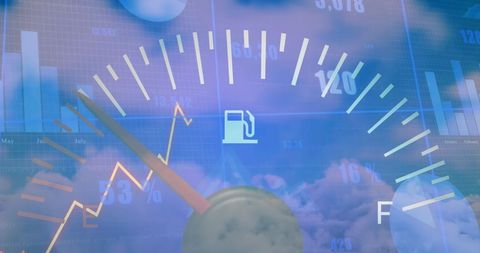
- Abstract Visualization of Fuel Economy and Data Analysis
Abstract Visualization of Fuel Economy and Data Analysis Image
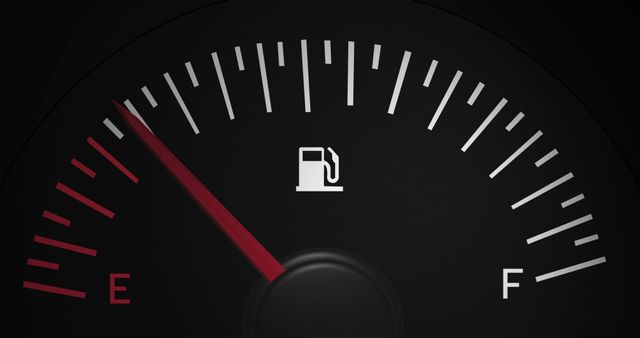
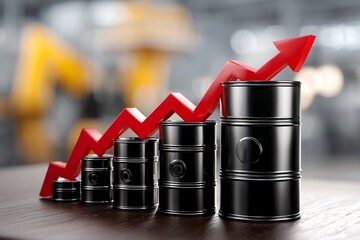
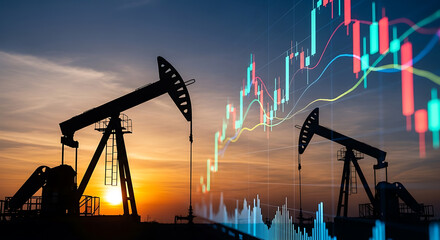
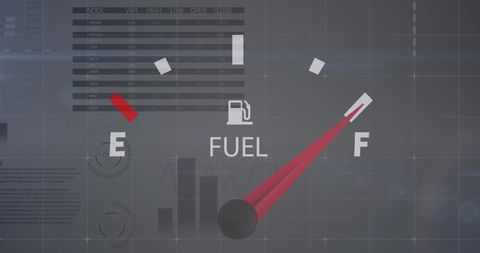
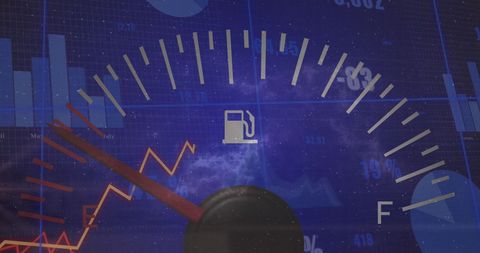
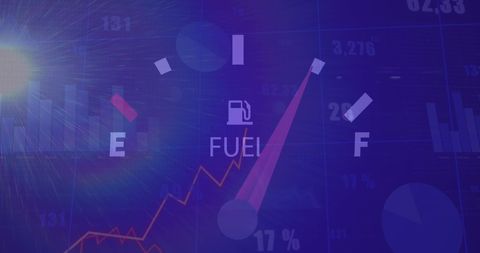
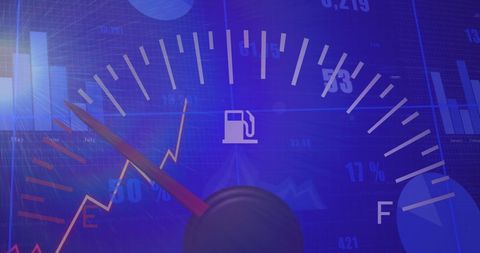
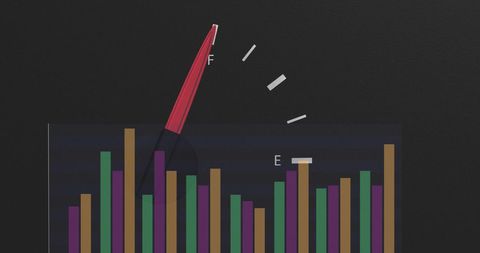
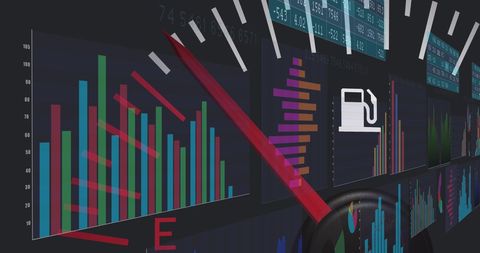
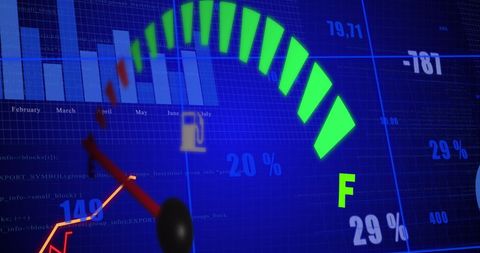
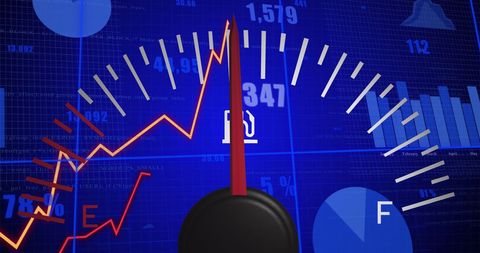
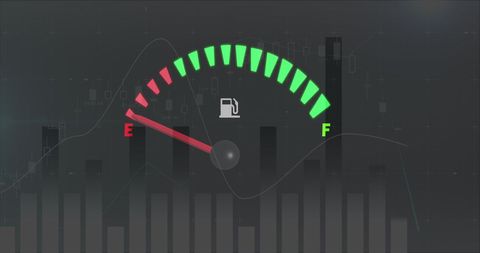
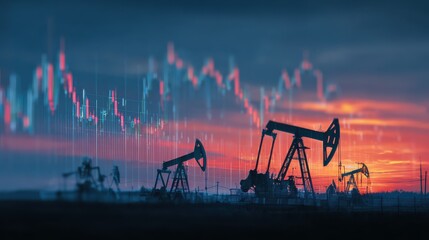
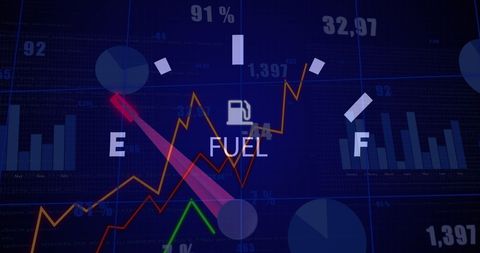
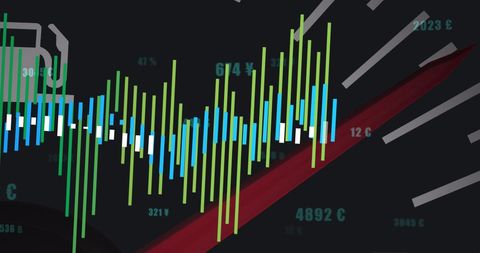
Conceptual digital art highlighting the interconnectedness of fuel pricing and financial data analysis. Useful for topics related to global business strategies, economic trends, energy markets, and data-driven decision-making in global finance.
Powered by 


0
downloads
downloads
Tags:
More
Credit Photo
If you would like to credit the Photo, here are some ways you can do so
Text Link
photo Link
<span class="text-link">
<span>
<a target="_blank" href=https://pikwizard.com/photo/abstract-visualization-of-fuel-economy-and-data-analysis/9ce36e6597da137011997dc47b24a2d0/>PikWizard</a>
</span>
</span>
<span class="image-link">
<span
style="margin: 0 0 20px 0; display: inline-block; vertical-align: middle; width: 100%;"
>
<a
target="_blank"
href="https://pikwizard.com/photo/abstract-visualization-of-fuel-economy-and-data-analysis/9ce36e6597da137011997dc47b24a2d0/"
style="text-decoration: none; font-size: 10px; margin: 0;"
>
<img src="https://pikwizard.com/pw/medium/9ce36e6597da137011997dc47b24a2d0.jpg" style="margin: 0; width: 100%;" alt="" />
<p style="font-size: 12px; margin: 0;">PikWizard</p>
</a>
</span>
</span>
Free (free of charge)
Free for personal and commercial use.
Author: Authentic Images
Similar Free Stock Images
Loading...

Premium
Premium

Premium


Premium


Premium


Premium


Premium


Premium

Premium

Premium


Premium


Premium


Premium


Premium


Premium


Premium


Premium


Premium


Premium
Premium
Premium
Premium


Premium


Premium

Premium