- Home >
- Stock Photos >
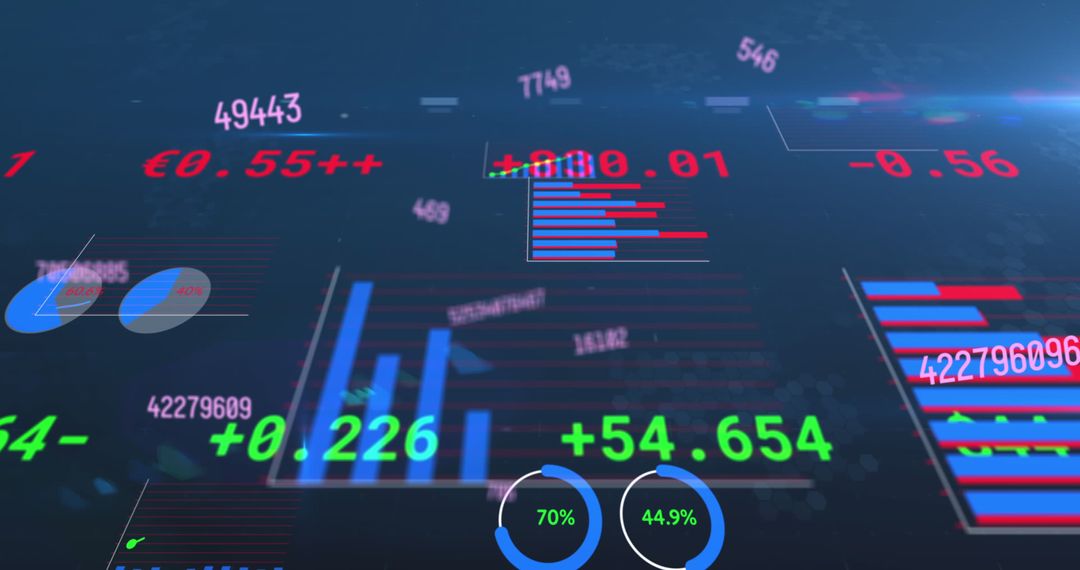
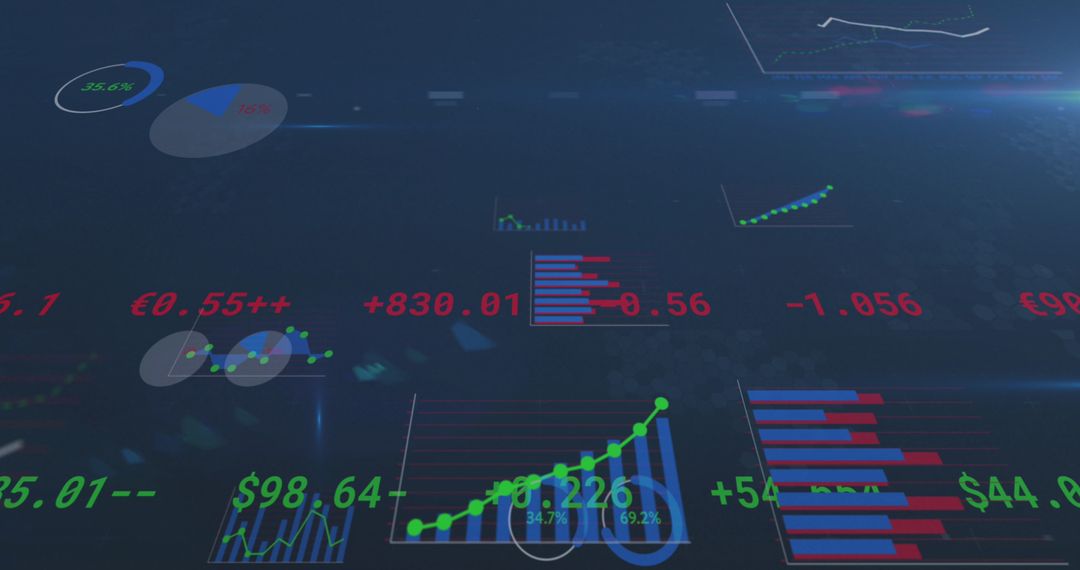
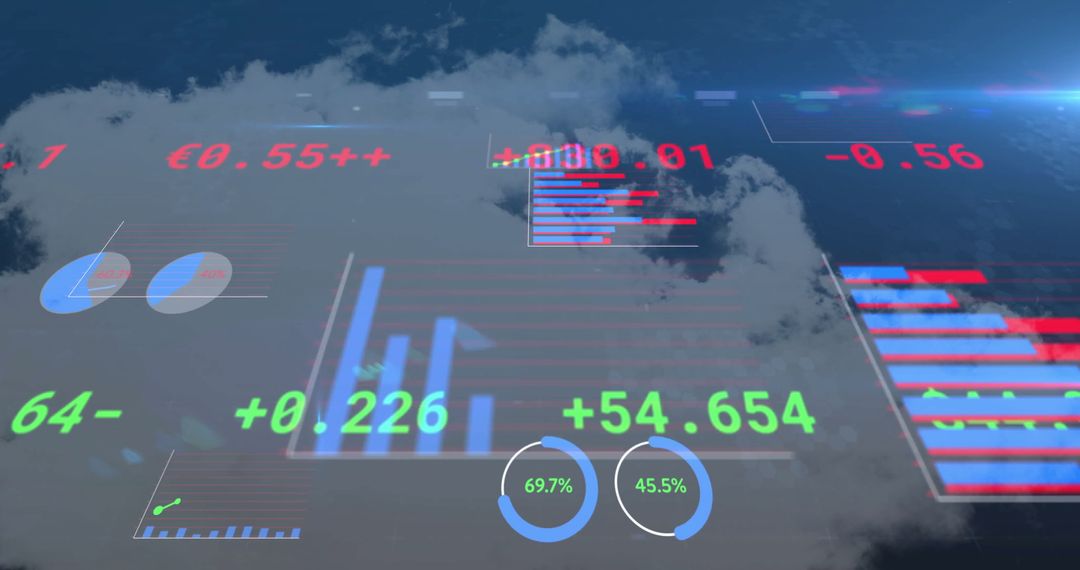
- Abstract Visualization of Stock Market Data on Digital Display
Abstract Visualization of Stock Market Data on Digital Display Image

Abstract digital imagery displaying fluctuating stock market data, ideal for illustrating concepts of global economy and investment trends. Useful for articles or presentations on financial analysis and technological integration in economic markets.
Powered by 


2
downloads
downloads
Tags:
More
Credit Photo
If you would like to credit the Photo, here are some ways you can do so
Text Link
photo Link
<span class="text-link">
<span>
<a target="_blank" href=https://pikwizard.com/photo/abstract-visualization-of-stock-market-data-on-digital-display/009cf028088740dbe7c6d5389586a7c0/>PikWizard</a>
</span>
</span>
<span class="image-link">
<span
style="margin: 0 0 20px 0; display: inline-block; vertical-align: middle; width: 100%;"
>
<a
target="_blank"
href="https://pikwizard.com/photo/abstract-visualization-of-stock-market-data-on-digital-display/009cf028088740dbe7c6d5389586a7c0/"
style="text-decoration: none; font-size: 10px; margin: 0;"
>
<img src="https://pikwizard.com/pw/medium/009cf028088740dbe7c6d5389586a7c0.jpg" style="margin: 0; width: 100%;" alt="" />
<p style="font-size: 12px; margin: 0;">PikWizard</p>
</a>
</span>
</span>
Free (free of charge)
Free for personal and commercial use.
Author: People Creations
Similar Free Stock Images

Premium


Premium


Premium


Premium


Premium


Premium


Premium


Premium


Premium


Premium


Premium


Premium


Premium


Premium


Premium


Premium


Premium


Premium


Premium


Premium


Premium


Premium


Premium


Premium