
- Home >
- Stock Photos >
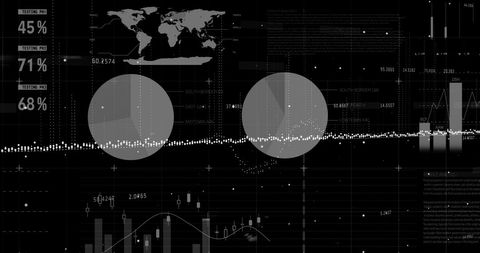
- Abstract World Data Visualization with Futuristic Elements
Abstract World Data Visualization with Futuristic Elements Image

This design depicts a dotted world map stretched across a grid with various digital elements, symbolizing data analytics and global technology trends. Ideal for illustrating concepts of global communications, financial data analysis, or representing statistics on a digital platform. Perfect for backgrounds in presentations, websites focusing on technology or business analytics, or educational content related to data science.
Powered by  - Get 15% off with code: PIKWIZARD15


downloads
Tags:
More
Credit Photo
If you would like to credit the Photo, here are some ways you can do so
Text Link
photo Link
<span class="text-link">
<span>
<a target="_blank" href=https://pikwizard.com/photo/abstract-world-data-visualization-with-futuristic-elements/008fada0f69a2a63836e2512627d0d4a/>PikWizard</a>
</span>
</span>
<span class="image-link">
<span
style="margin: 0 0 20px 0; display: inline-block; vertical-align: middle; width: 100%;"
>
<a
target="_blank"
href="https://pikwizard.com/photo/abstract-world-data-visualization-with-futuristic-elements/008fada0f69a2a63836e2512627d0d4a/"
style="text-decoration: none; font-size: 10px; margin: 0;"
>
<img src="https://pikwizard.com/pw/medium/008fada0f69a2a63836e2512627d0d4a.jpg" style="margin: 0; width: 100%;" alt="" />
<p style="font-size: 12px; margin: 0;">PikWizard</p>
</a>
</span>
</span>
Free (free of charge)
Free for personal and commercial use.
Author: Awesome Content
Similar Free Stock Images

Premium


Premium


Premium


Premium


Premium


Premium

Premium


Premium

Premium


Premium


Premium

Premium

Premium


Premium

Premium


Premium


Premium


Premium


Premium


Premium


Premium


Premium


Premium

Premium


Premium


Explore More Free Stock Images