- Home >
- Stock Photos >
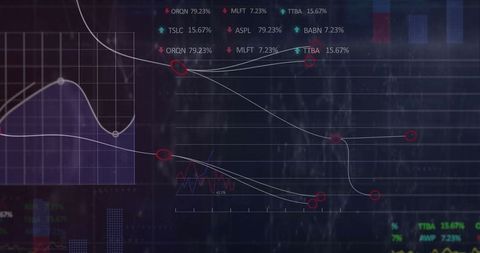
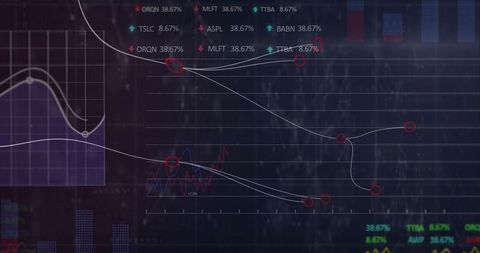
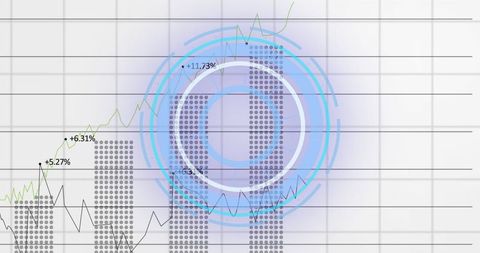
- Advanced Data Dashboard with Circular HUD and Chart Visualization
Advanced Data Dashboard with Circular HUD and Chart Visualization Image

This digital interface presents a complex data dashboard featuring a circular HUD element alongside a dynamic line chart. It is designed with percentage labels and zigzag subgraphs incorporated, ideal for projects focusing on analytics, data visualization, and modern technology themes. The image can be utilized in website designs related to tech startups, financial analysis platforms, or educational graphics explaining advanced data analytics techniques.

downloads
Tags:
More
Credit Photo
If you would like to credit the Photo, here are some ways you can do so
Text Link
photo Link
<span class="text-link">
<span>
<a target="_blank" href=https://pikwizard.com/photo/advanced-data-dashboard-with-circular-hud-and-chart-visualization/db7bf369c4427d4ba2730e157fb549ff/>PikWizard</a>
</span>
</span>
<span class="image-link">
<span
style="margin: 0 0 20px 0; display: inline-block; vertical-align: middle; width: 100%;"
>
<a
target="_blank"
href="https://pikwizard.com/photo/advanced-data-dashboard-with-circular-hud-and-chart-visualization/db7bf369c4427d4ba2730e157fb549ff/"
style="text-decoration: none; font-size: 10px; margin: 0;"
>
<img src="https://pikwizard.com/pw/medium/db7bf369c4427d4ba2730e157fb549ff.jpg" style="margin: 0; width: 100%;" alt="" />
<p style="font-size: 12px; margin: 0;">PikWizard</p>
</a>
</span>
</span>
Free (free of charge)
Free for personal and commercial use.
Author: Authentic Images