- Home >
- Stock Photos >
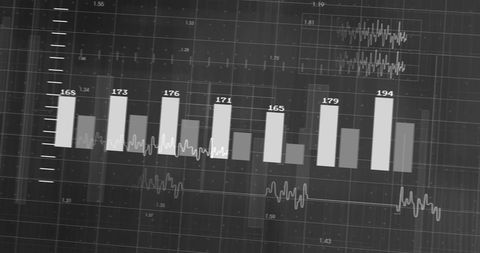
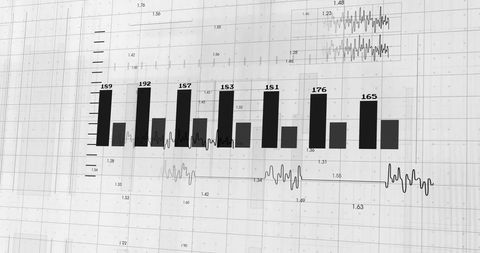
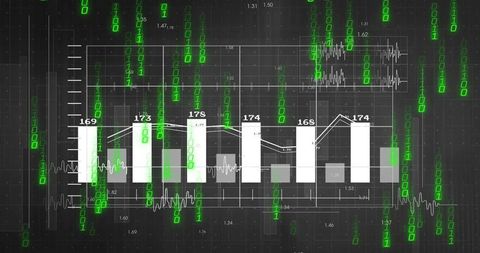
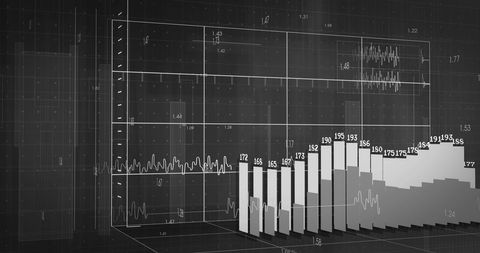
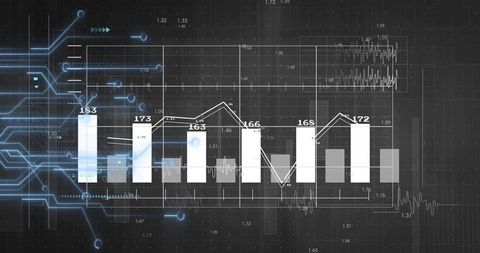
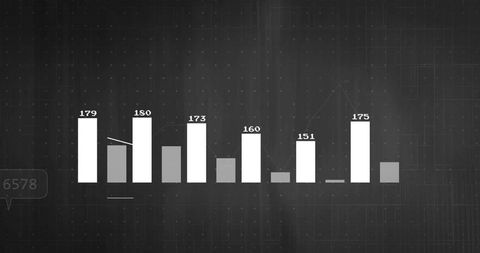
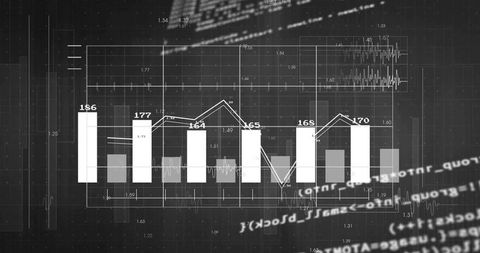
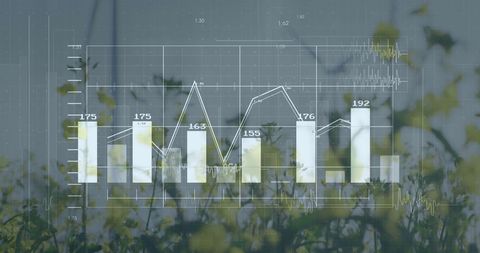
- Advanced Data Visualization with Bar and Line Chart on Dashboard
Advanced Data Visualization with Bar and Line Chart on Dashboard Image

This bart-text linesnimal background is suitable for illustrating complex financial analytics, performance reporting, or technology dashboards. Ideal for articles or presentations on data-driven decision-making in business or finance.

downloads
Tags:
More
Credit Photo
If you would like to credit the Photo, here are some ways you can do so
Text Link
photo Link
<span class="text-link">
<span>
<a target="_blank" href=https://pikwizard.com/photo/advanced-data-visualization-with-bar-and-line-chart-on-dashboard/2c8242836d30e55c18fbd4507936c375/>PikWizard</a>
</span>
</span>
<span class="image-link">
<span
style="margin: 0 0 20px 0; display: inline-block; vertical-align: middle; width: 100%;"
>
<a
target="_blank"
href="https://pikwizard.com/photo/advanced-data-visualization-with-bar-and-line-chart-on-dashboard/2c8242836d30e55c18fbd4507936c375/"
style="text-decoration: none; font-size: 10px; margin: 0;"
>
<img src="https://pikwizard.com/pw/medium/2c8242836d30e55c18fbd4507936c375.jpg" style="margin: 0; width: 100%;" alt="" />
<p style="font-size: 12px; margin: 0;">PikWizard</p>
</a>
</span>
</span>
Free (free of charge)
Free for personal and commercial use.
Author: Creative Art