1. Home > 
  2. Stock Photos > 
  3. Advanced Data Visualization with Global Financial Insights

Advanced Data Visualization with Global Financial Insights Image

Advanced Data Visualization with Global Financial Insights

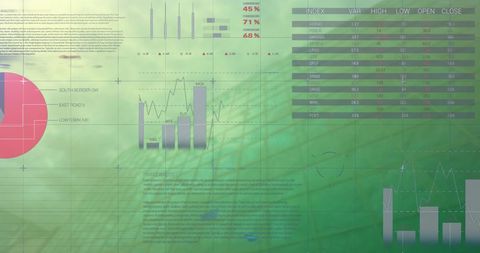
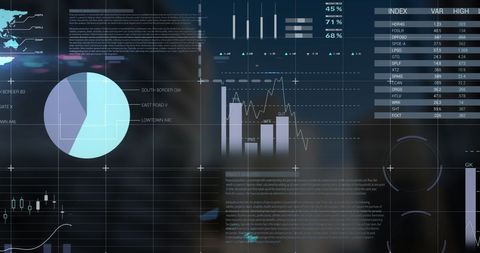
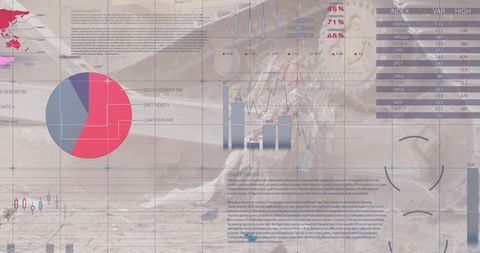
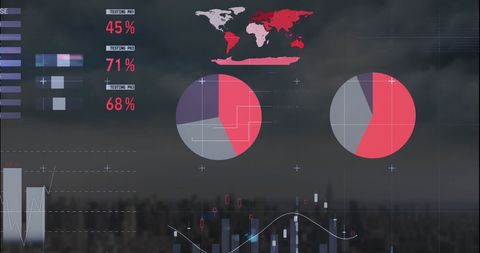
Overlay image focusing on financial data representation with charts and graphics, giving insights into global financial markets. Useful for illustrating articles on data analytics, investment strategy, stock market trends, and global business dynamics.

Powered by Shutterstock logo - Get 15% off with code: PIKWIZARD15
Data and AI Powering Global Analytics: Visualize data-driven insights with AI and big data, showcasing global networks, large language models, artificial neural network and digital transformation. - Powered by Shutterstock - Get 15% off with code: PIKWIZARD15Man look at the dashboard with graphs and charts. Concept of data management system, business intelligence, data statistics, marketing analysis, key performance indicators (KPI) and analytics. - Powered by Shutterstock - Get 15% off with code: PIKWIZARD15Man look at the dashboard with graphs and charts. Concept of data management system, business intelligence, data statistics, marketing analysis, key performance indicators (KPI) and analytics. - Powered by Shutterstock - Get 15% off with code: PIKWIZARD15Big data and analytics visualization technology with scientist analyzing information structure on screen with machine learning to extract predictions for business, finance, internet of things - Powered by Shutterstock - Get 15% off with code: PIKWIZARD15Big data analytics visualization technology with scientist analyzing information structure on screen with machine learning to extract strategical prediction for business, finance, internet of things - Powered by Shutterstock - Get 15% off with code: PIKWIZARD15

Credit Photo

If you would like to credit the Photo, here are some ways you can do so

Free (free of charge)

Free for personal and commercial use.

Author: Awesome Content

Similar Free Stock Images

Abstract Financial Data with Global Theme and Cityscape
Premium
A magnifying glass over a financial chart, illustrating market analysis and business concepts, in blue light against a dark background.
Advanced Data Interface with Stock Market Analytics Graphics
Global Data Processing with Digital Interface Concepts
Futuristic Data Analysis Interface with Graphs and Charts
Data Analytics Visualization with Global Business Dashboard
Premium
Global economy financial analysis international trade, market trends economic growth, gdp data global finance business strategy, indicators digital transformation world economy statistics
Digital Data Interface Over Urban Landscape with Analytics
Overlay of Financial Data Visualizations on Cityscape
Global Data Analysis with Digital Technology Visuals
Statistical Data Analysis Overlay on Cityscape Background
Premium
Big data and analytics visualization technology with scientist analyzing information structure on virtual screen,iot,  finance, machine learning to extract predictions for business.
Digital Financial Data Display with Charts and Graphs
Futuristic Infographic Interface Over Cityscape Background
Futuristic Data Interface Over Cityscape with Spinning Globe
Global Financial Data Analysis with Charts and Diagrams
Premium
Big data and analytics visualization technology with scientist analyzing information structure on screen with machine learning to extract predictions for business, finance, internet of things
Digital Technology Abstract Background with Data Graphics
Digital Infographic Interface in Urban Setting
Digital Finance Brainscape: Data Visualization Overlapping Silhouette
Digital Financial Analytics Displayed Over Cityscape
Premium
Asia people young casual woman remote work at desk home phone call talk study learn MBA online class. SEO sale plan report data chart graph on desktop PC screen reskill upskill career job workforce.
Global Data Processing with Overlay Conceptual Graphics
Digital Interface with Global Financial Data in Empty Office
Data Visualization Illustrating Global Finance and Statistics
Financial Data Processing Over Cityscape with Global Connections
Premium
Businessman interacting with a glowing financial graph, representing stock market growth, investment trends, economic success, financial analytics, business strategy, and data-driven decision-making.
Futuristic Globe Overlapping Urban Cityscape for Digital Innovation
Corporate Office with Semi-Transparent Data Dashboard
Digital Analytics Dashboard with Wood Texture Background
Data Visualization with Globe and Gears on Technology Dashboard
Abstract Visual: Data Analytics and Graph Processing Concept
Abstract Digital Interface with Data Visualizations over Cityscape
Premium
Image of scope scanning and financial data processing over cityscape. Global finance, business, connections, computing and data processing concept digitally generated image.
Futuristic Data Analytics Visualization with Global Interface
Dynamic Digital Interface with Stock Market Analysis
Digital Display of Global Data and Analytics Interface Technology
Data Analysis Overlapping Tech Graphics on Server Lights
Premium
An AI assistant manages a business intelligence dashboard, providing automated data analysis. The system visualizes global metrics and team performance for strategic insights. Parse
Digital Data Analytics and Global Connection Interface
Digital Data Analytics Overlay with City Background
Statistical Data Visualization Over Aerial Cityscape Background
Blue Digital Interface with Charts and Graphics
Premium
Business analyst use digital tablet and laptop, holographic financial dashboard, global data visualization, represent fintech innovation, AI-driven investment analysis, smart business growth strategy.
Global Financial Data and Analytics Visualization Concept
Digital Database Interface with Spinning Globe and Data Graphics
Global Financial Statistics and Data Processing on Building Background
Abstract High-Tech Statistical Data Interface
Premium
Business analyst using digital tablet and laptop with holographic data charts and financial analytics dashboard, representing big data visualization, fintech investment, and smart business strategy.
Global Financial Data Visualization with Statistics and Charts
Financial Data Visualization Over Metropolitan Skyline
Global Financial Data Processing with Charts and Graphs
Digital Financial Data Analytics Over Urban Background
Premium
A dynamic financial graph illustrates market growth, with a focus on data visualization and upward trends. The image uses vibrant colors to highlight key financial data.
Cityscape Overlay with Financial and Data Metrics Visualization
Digital Financial Data with Graphs and Analytics Overlay
Financial Data and Global Connections Over Cityscape
Global Finance Analytics with Digital Data Overlay
Premium
Two hands manipulate data visualizations on a bright blue background featuring a world map. Charts and graphs illustrate financial trends, indicating analysis and review.
Global Business Analytics Dashboard Displaying Data Visualizations
Futuristic HUD Interface with Neon Graphs and Analytics
Futuristic Data Visualization with World Map and Charts
Global Financial Data Analysis Over High-Speed Cityscape
Digital Analytics Dashboard Interface Over City
Digital Analytics Dashboard with Pinpoint Maps and Graphs
Premium
Big data and analytics visualization technology with scientist analyzing information structure on screen with machine learning to extract predictions for business, finance, internet of things
Business Team Analyzing Global Financial Data Visualization
Dynamic Financial Graphs and Numbers on Grey Background
Abstract Financial Data with Business Background
Global Data Processing and Tech Interface Concept
Premium
Man in pajamas holding out a hand with glowing holographic financial graphs, charts, and data visualizations, symbolizing data analysis, investment, and digital finance.
Digital Financial Data Interface on Virtual Screen
Data Processing with Digital Interface Over Cityscape
Digital Composite Infographic Interface Cityscape
Environmental Data Visualization with Heavy Machinery Graph
Premium
An AI assistant manages a business intelligence dashboard, providing automated data analysis. The system visualizes global metrics and team performance for strategic insights. Parse
Futuristic Business Interface with Data Charts Against Skyscraper
Global Financial Data Interface on Modern Building Background
Statistical Data Processing Over Network with City Background
Cityscape Data Visualization Technology Interface
Premium
Businessman’s Hands Displaying Virtual Screen with Data Analysis and Rising Market Trends Visualizing Economic Growth Through Demand, Supply, Price, and Tax Analysis for Business Strategy
Financial Data Processing Concept Over Urban Landscape
Digital Data Charts Overlapping Urban Cityscape
Futuristic Interface Displaying Global Data Analytics Processing
Digital Analytics Interface Overlaying Cityscape for Financial Marketing
Premium
Image of financial data processing over office building. Global finance, business, connections, computing and data processing concept digitally generated image.
Digital Financial Data and Cityscape Integration Visualization
Digital Financial Data Visualization on Urban Background
Global Finance Scanning with Cityscape Background
Global Data Analysis in Modern Warehouse Environment
Premium
Asia people young casual woman remote work at desk home phone call talk study learn MBA online class. SEO sale plan report data chart graph on desktop PC screen reskill upskill career job workforce.
Digital Analytics Overlapping Serene Coastal Sunset for Tech Inspiration
Data Analytics Overlay on City Skyline Illustrating Futuristic Business Trends
Futuristic Digital Interface with City Skyline
Data and Analytics Overlay on Bustling Cityscape
Abstract Digital Interface with Charts and Graphs Overlay
Innovative Global Business Data Interface Concept
Premium
Data analysts working on data analytics and visualization with machine learning on computer screen in modern office. Data science in business, finance and innovation.
Global Business Analytics with Digital Interfaces
Futuristic Financial Data Processing on Digital Screen
Cityscape Background with Data Analytics Elements Overlay
City Overlaid with Financial Charts and Global Data Visuals
Premium
Man in glasses thinking, surrounded by futuristic digital swirl patterns and data streams, symbolizing innovation, technology, artificial intelligence, and deep analytical thinking.
Businessman Analyzing Digital Global Financial Data
Futuristic Digital Interface with Data Analytics Display
Digital Financial Dashboard with Cityscape Background
Innovative Data Interface with Business Analytics Over Cityscape
Premium
Asia people young casual woman remote work at desk home phone call talk study learn MBA online class. SEO sale plan report data chart graph on desktop PC screen reskill upskill career job workforce.
Digital Infographic and Cityscape Displaying Global Business Data
Abstract Data Interface in Urban Context Representing Business Trends
Dynamic Business Data Graphics with Urban City Background
Business Data Analysis Overlay on Stormy Sky Background
Premium
A woman uses a smartphone with holographic 2026 data charts and AI analytics representing financial growth future technology and digital economy development through data visualization
Data Visualization with Charts Over City Skyline
Financial Data Analysis Plus Equity Market Trends
Digital Interface with Financial Charts and Data Overlaid on Cityscape
Abstract Financial Data Overlay Design with Cityscape Background
Premium
Digital financial data visualization featuring glowing red and yellow lines across a dark screen, illustrating market trends, volatility, and the dynamic rhythm of active trading activity.
Financial Data with Pie and Bar Graphs on Dark Digital Background
Abstract Data Visualization Overlay on Urban Cityscape
Dynamic Global Business Data and Financial Charts Overlay
Innovative Agribusiness Analytics Over Farmland Landscape
Premium
A person analyzes financial data on a laptop while handling coins. Visual graphics of a world map with warning symbols illustrate potential risks in digital finance.
Futuristic Financial Dashboard Over Cityscape with Data Visualizations