- Home >
- Stock Photos >
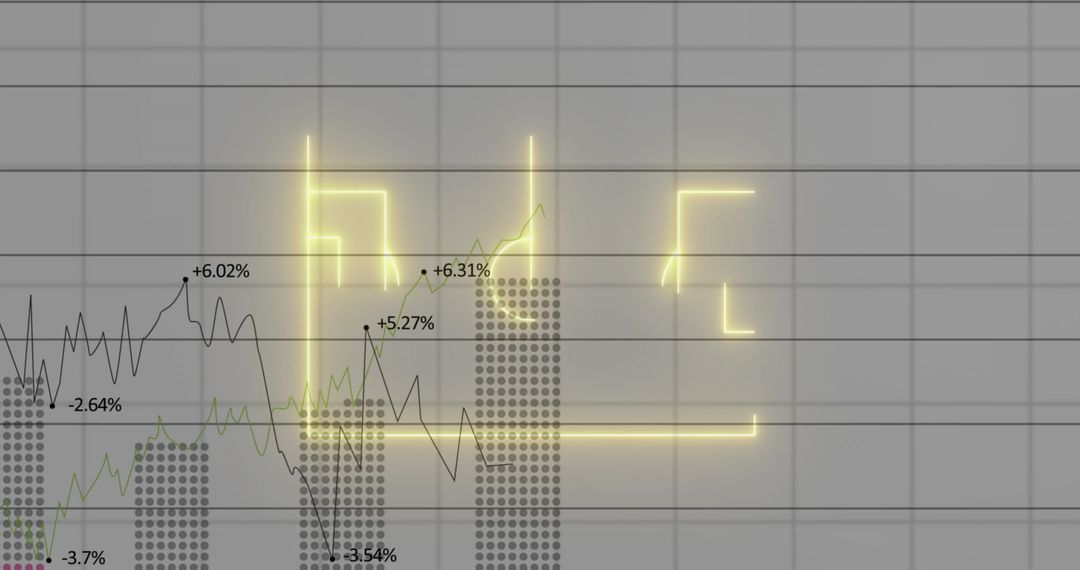
- Advanced Digital Dashboard with Rising Bar and Line Charts
Advanced Digital Dashboard with Rising Bar and Line Charts Image

Illustrates a digital dashboard focusing on analytics and data visualization. Useful for presentations involving financial progress, business insights, or performance metrics. Ideal for corporate settings aiming to highlight data-driven decision-making in a modern and engaging manner.
Powered by  - Get 15% off with code: PIKWIZARD15


0
downloads
downloads
Tags:
More
Credit Photo
If you would like to credit the Photo, here are some ways you can do so
Text Link
photo Link
<span class="text-link">
<span>
<a target="_blank" href=https://pikwizard.com/photo/advanced-digital-dashboard-with-rising-bar-and-line-charts/47ee5b21f293866baec50f071d1ee775/>PikWizard</a>
</span>
</span>
<span class="image-link">
<span
style="margin: 0 0 20px 0; display: inline-block; vertical-align: middle; width: 100%;"
>
<a
target="_blank"
href="https://pikwizard.com/photo/advanced-digital-dashboard-with-rising-bar-and-line-charts/47ee5b21f293866baec50f071d1ee775/"
style="text-decoration: none; font-size: 10px; margin: 0;"
>
<img src="https://pikwizard.com/pw/medium/47ee5b21f293866baec50f071d1ee775.jpg" style="margin: 0; width: 100%;" alt="" />
<p style="font-size: 12px; margin: 0;">PikWizard</p>
</a>
</span>
</span>
Free (free of charge)
Free for personal and commercial use.
Author: Authentic Images
Similar Free Stock Images
Premium


Premium


Premium


Premium


Premium


Premium


Premium


Premium


Premium


Premium


Premium


Premium


Premium


Premium


Premium


Premium


Premium


Premium


Premium


Premium


Premium


Premium


Premium


Premium