- Home >
- Stock Photos >
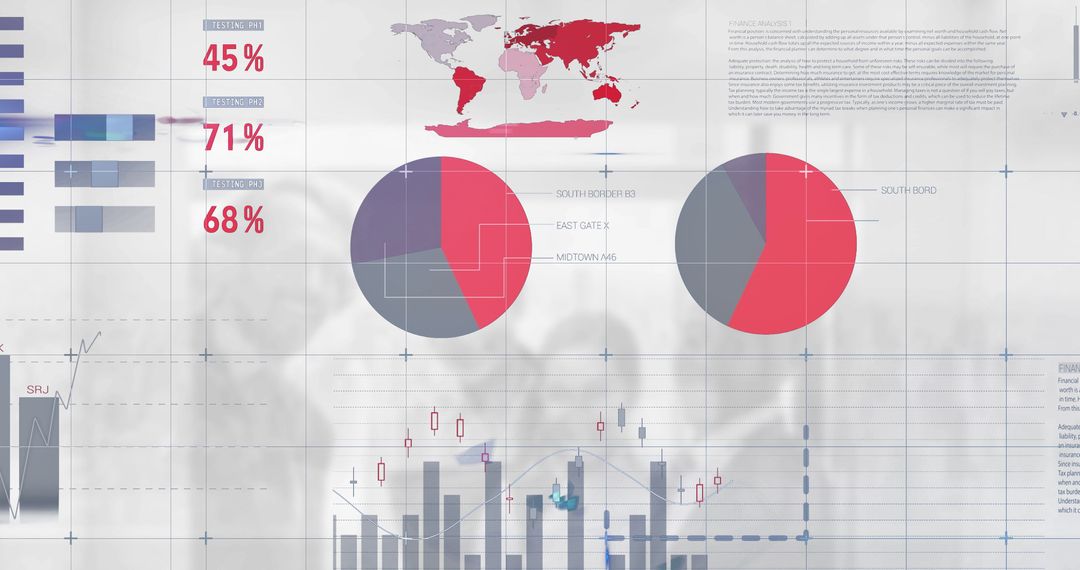
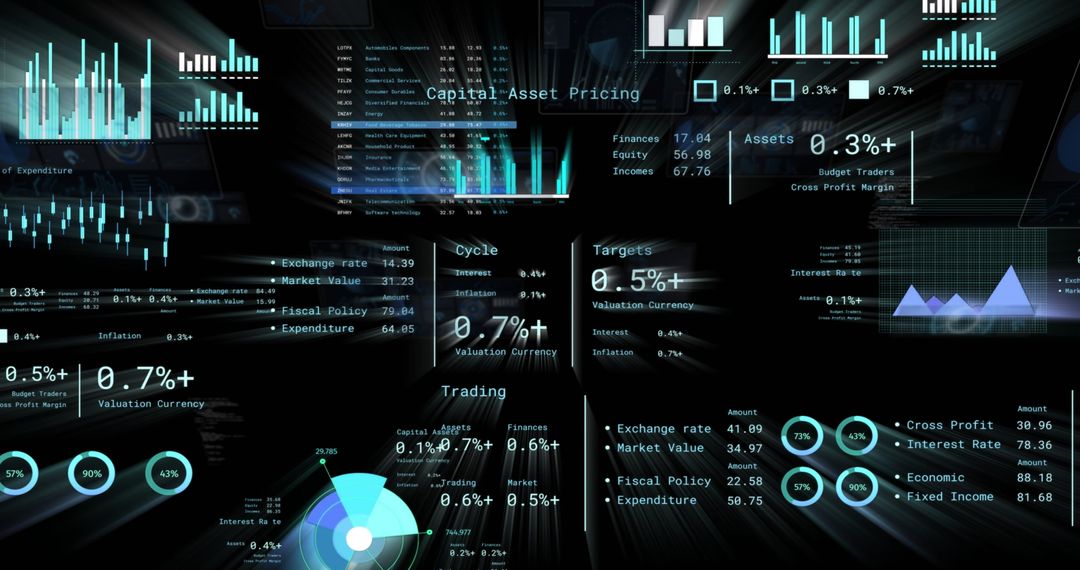
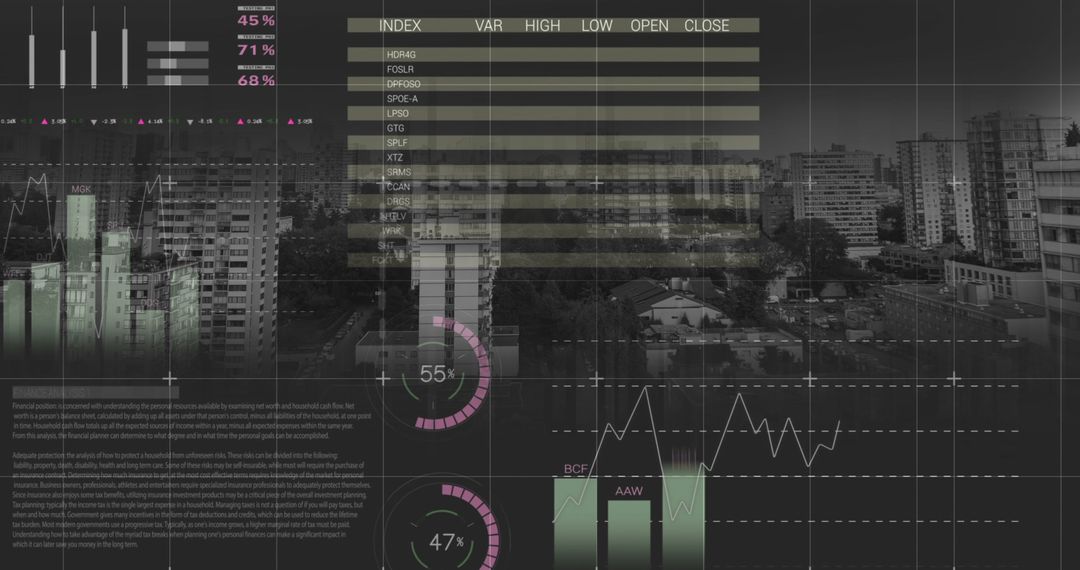
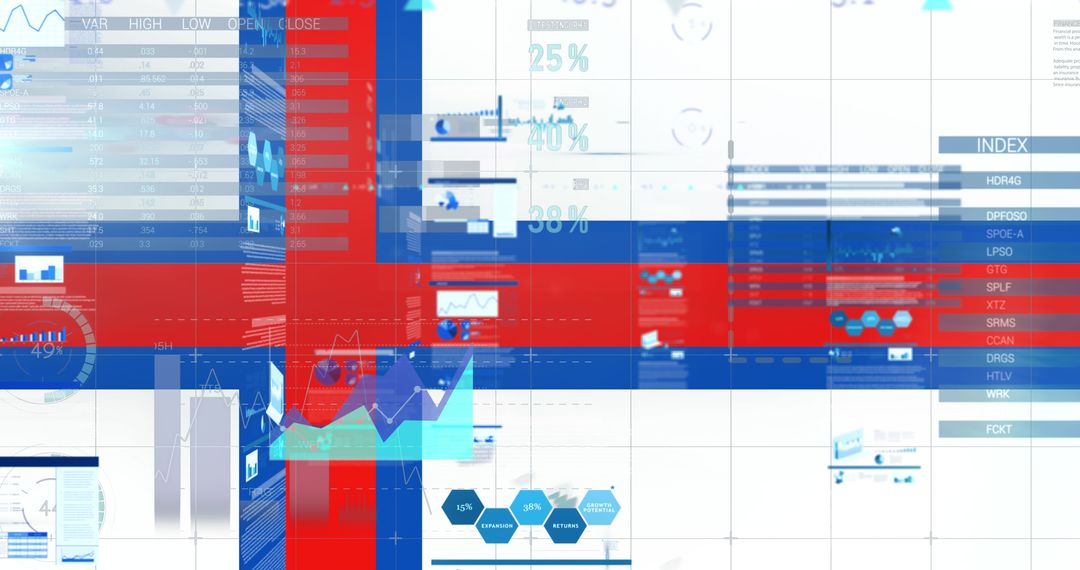
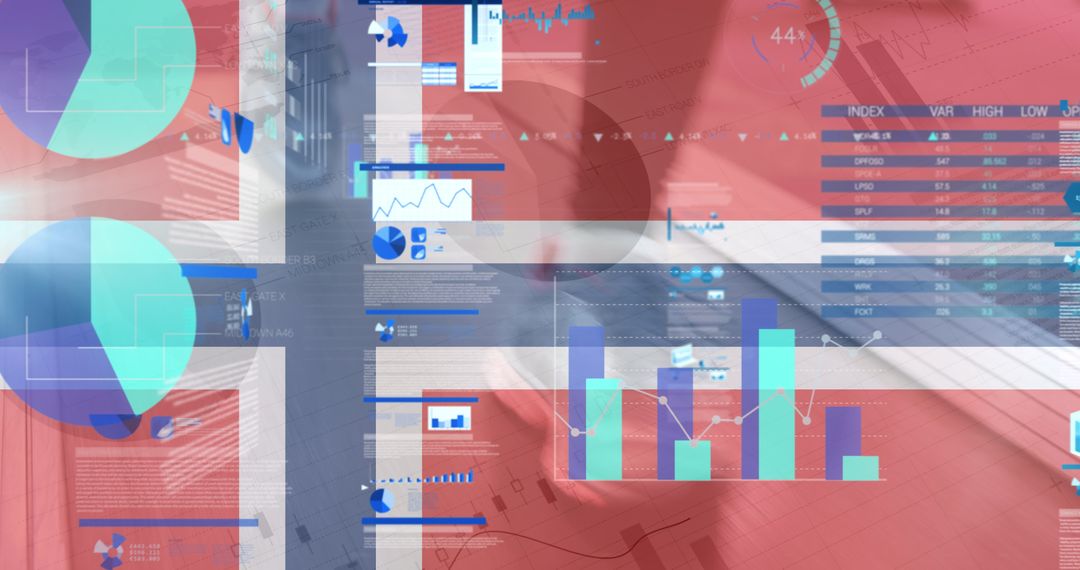
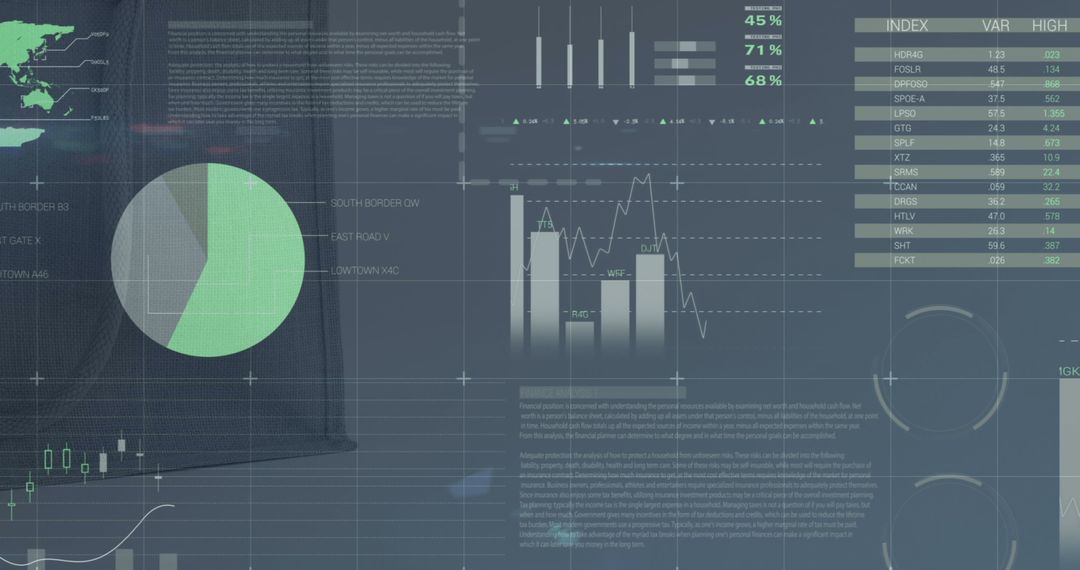
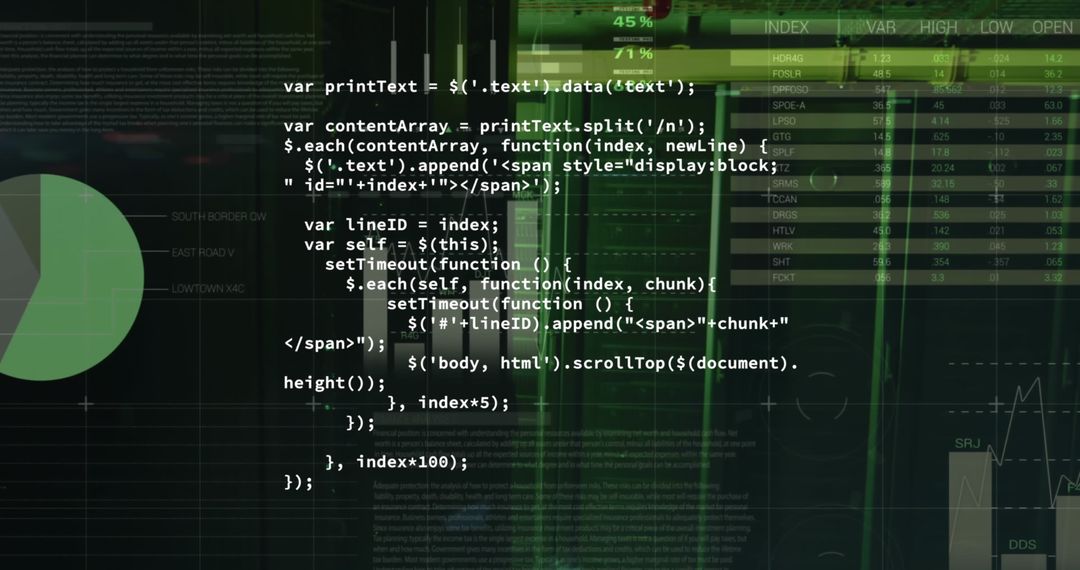
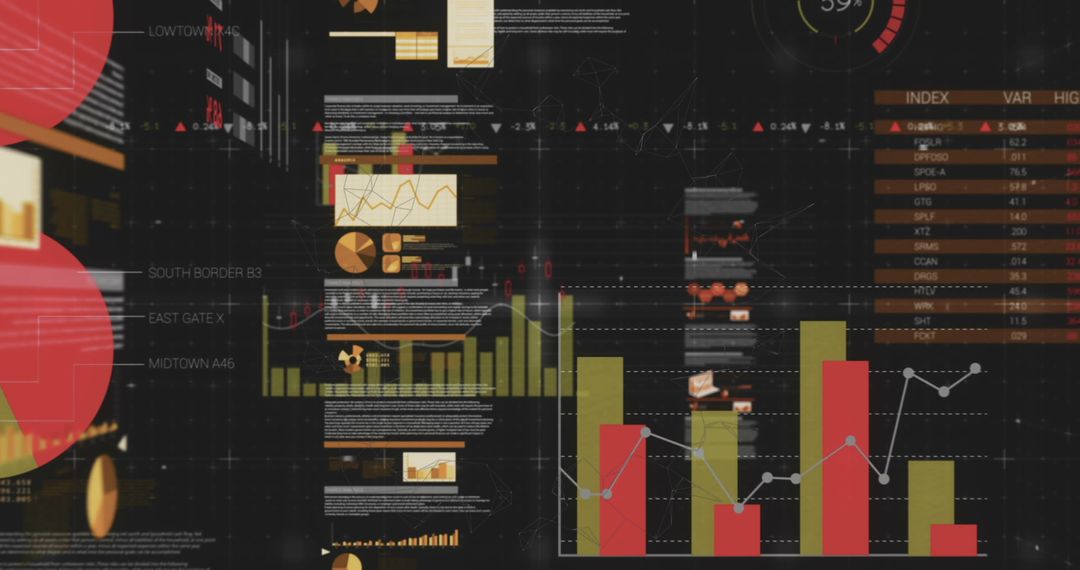
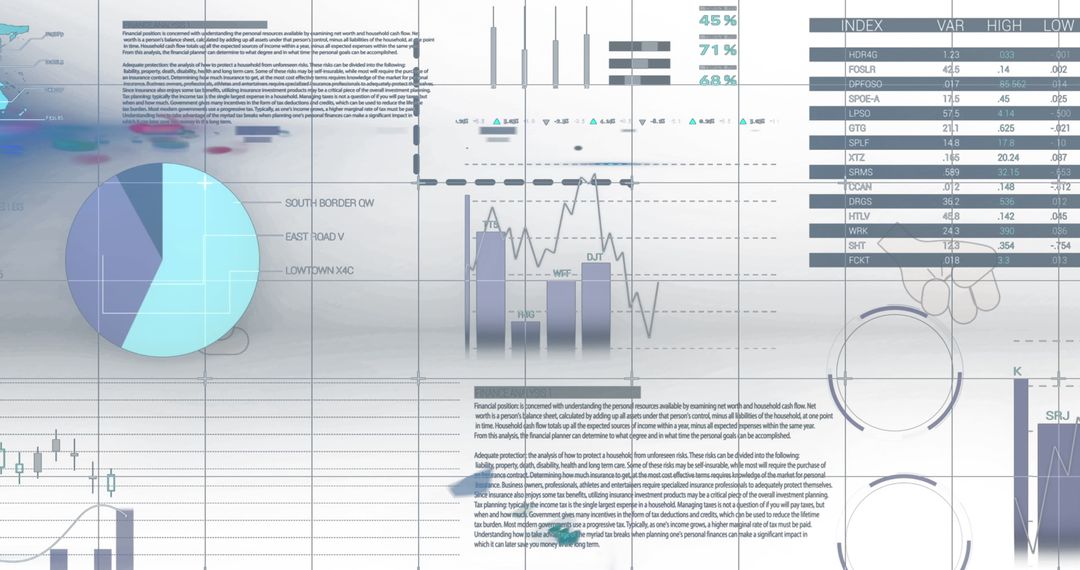
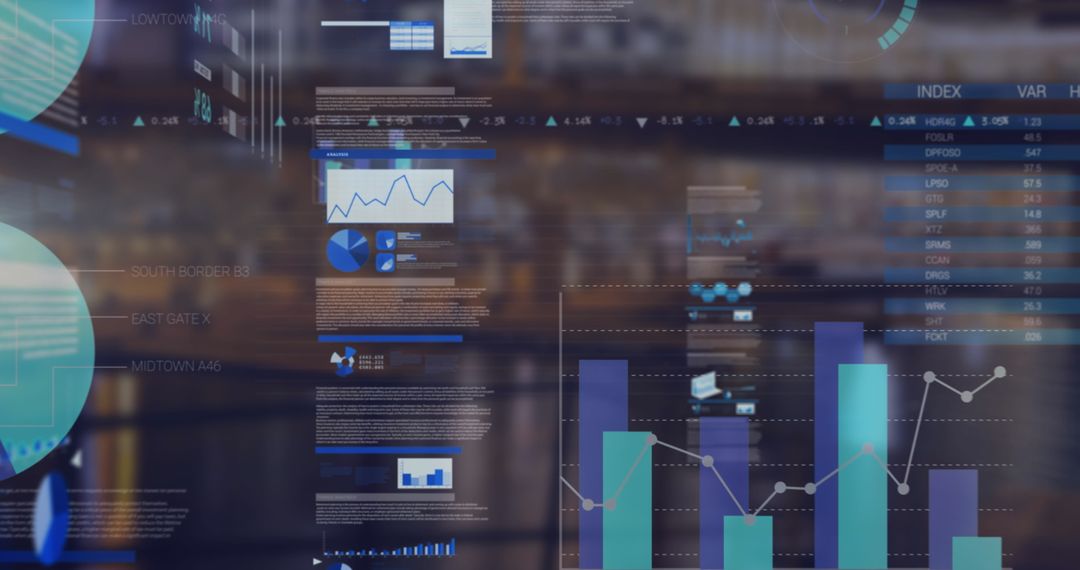
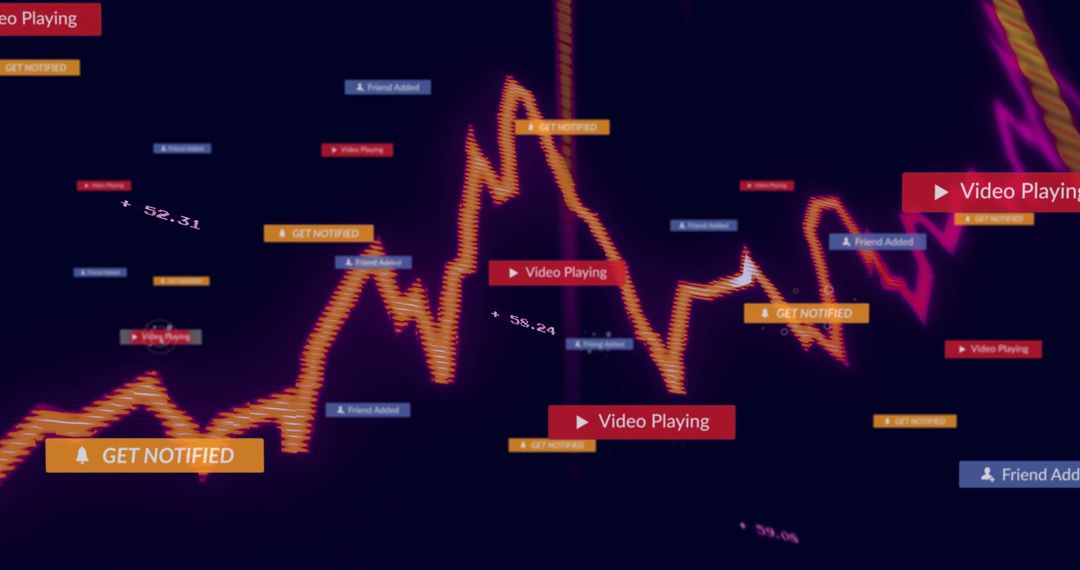
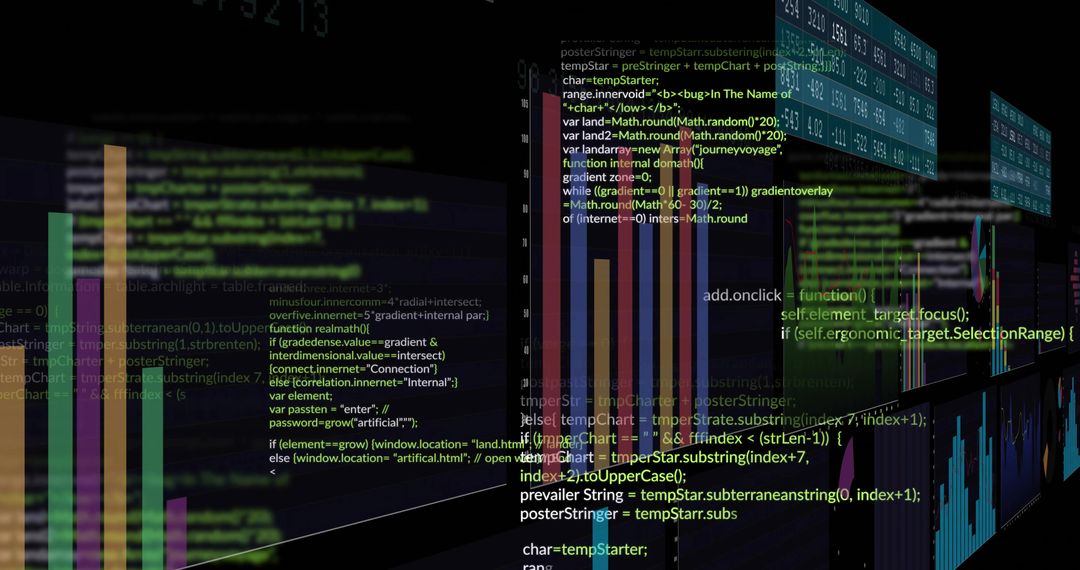
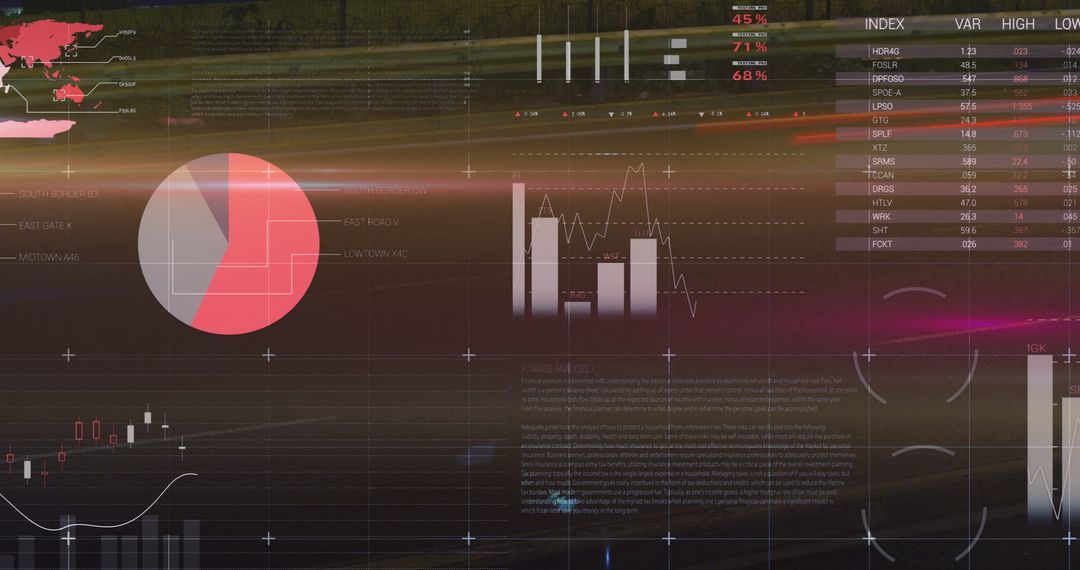
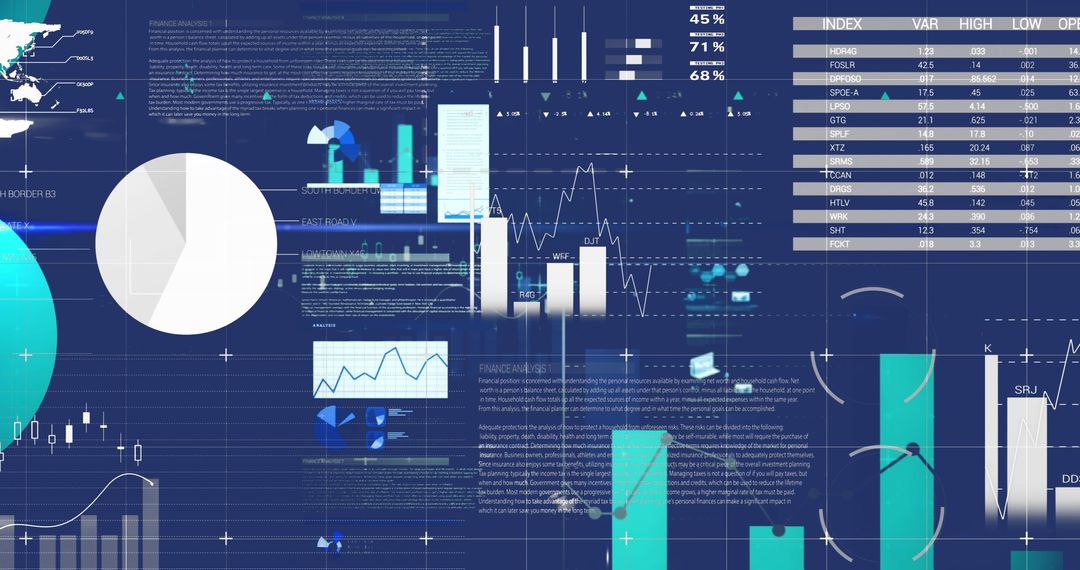
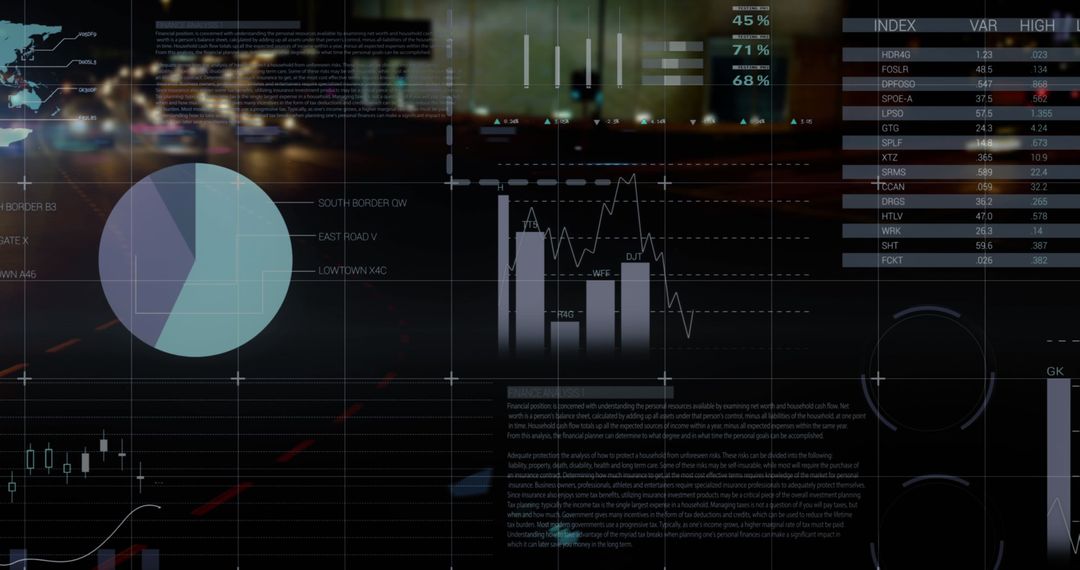
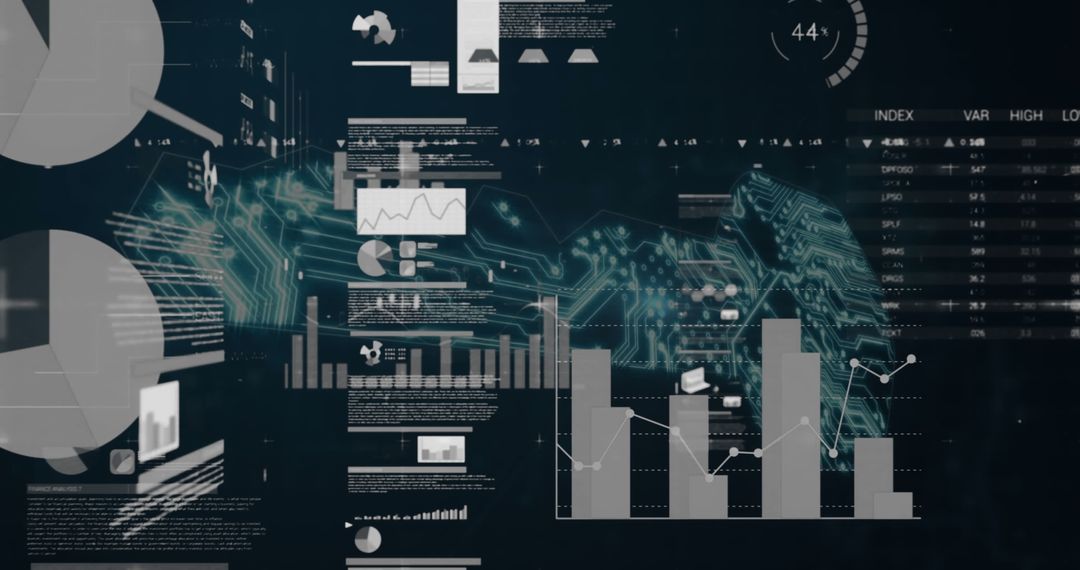
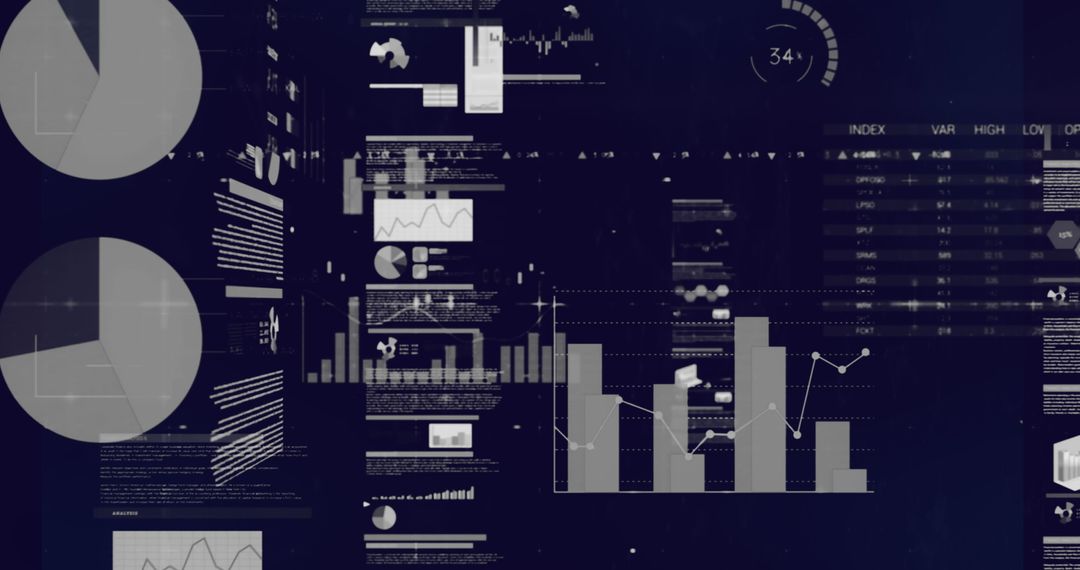
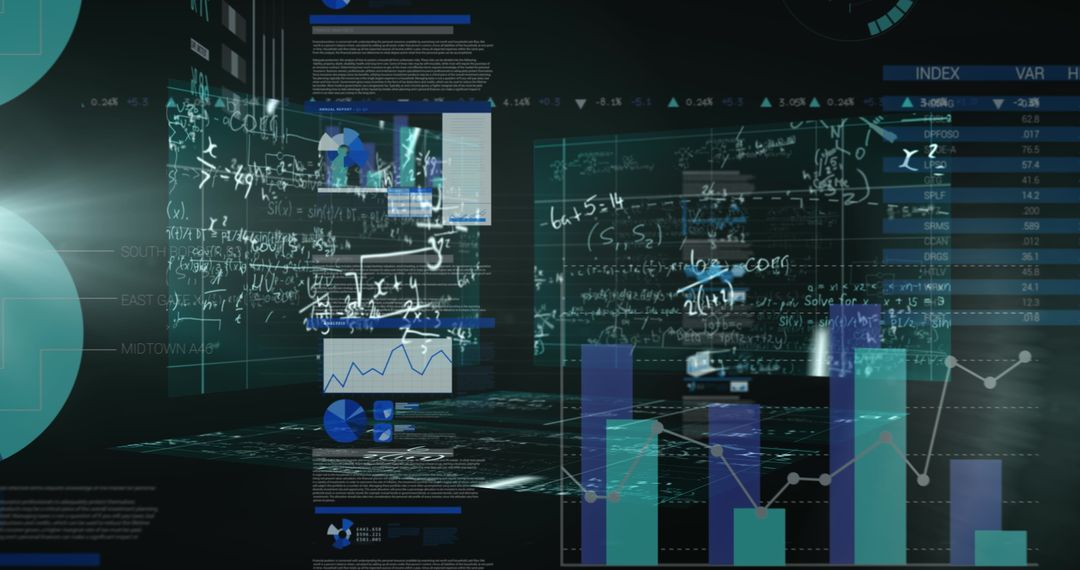
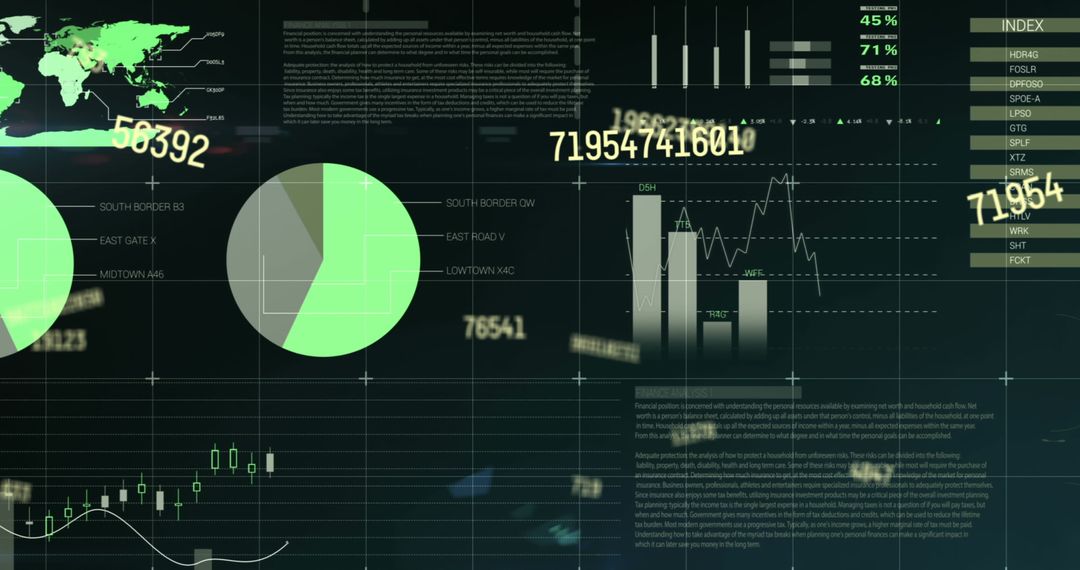
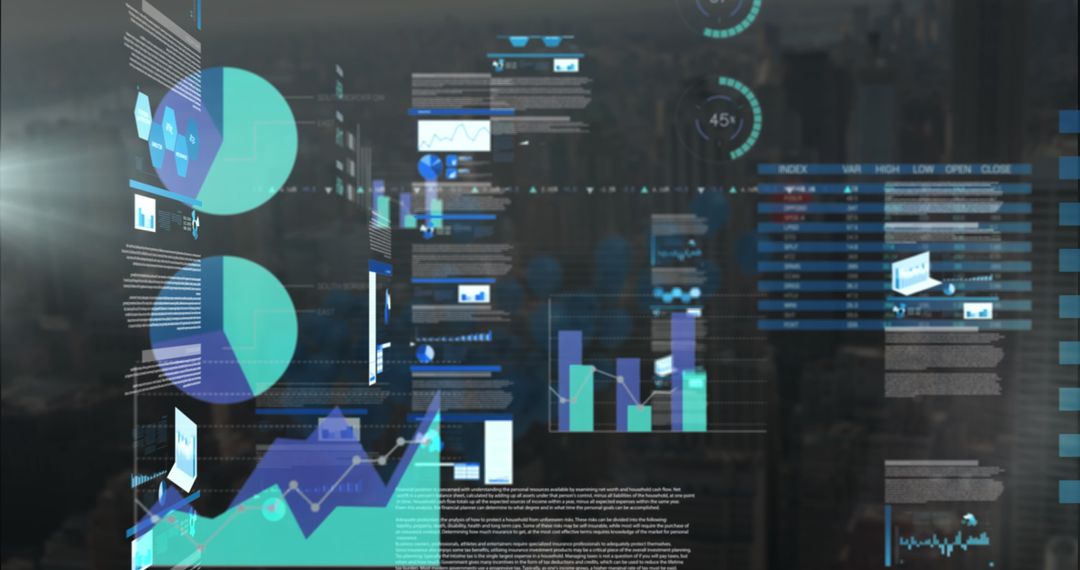
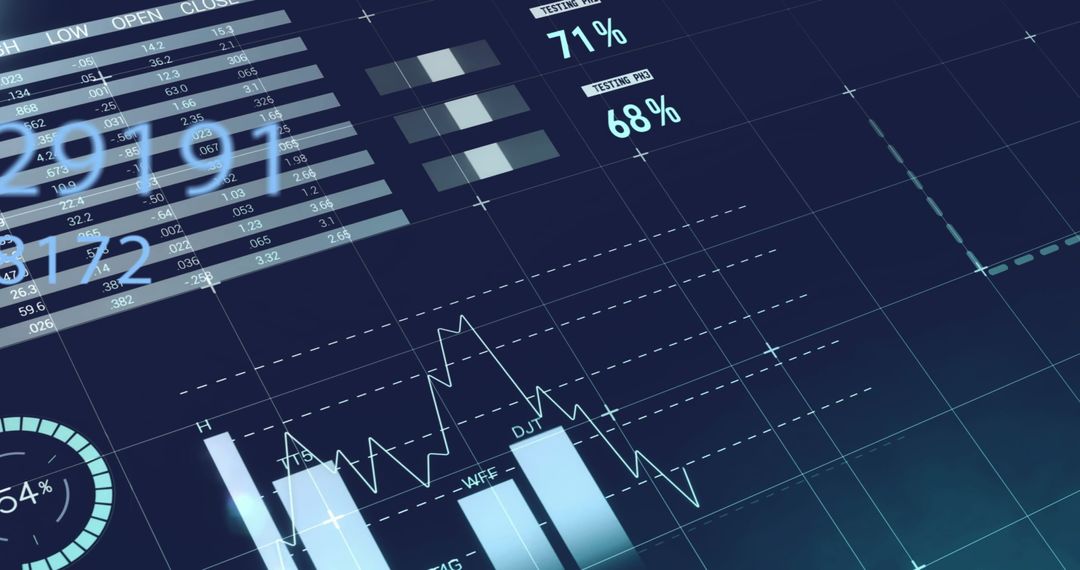
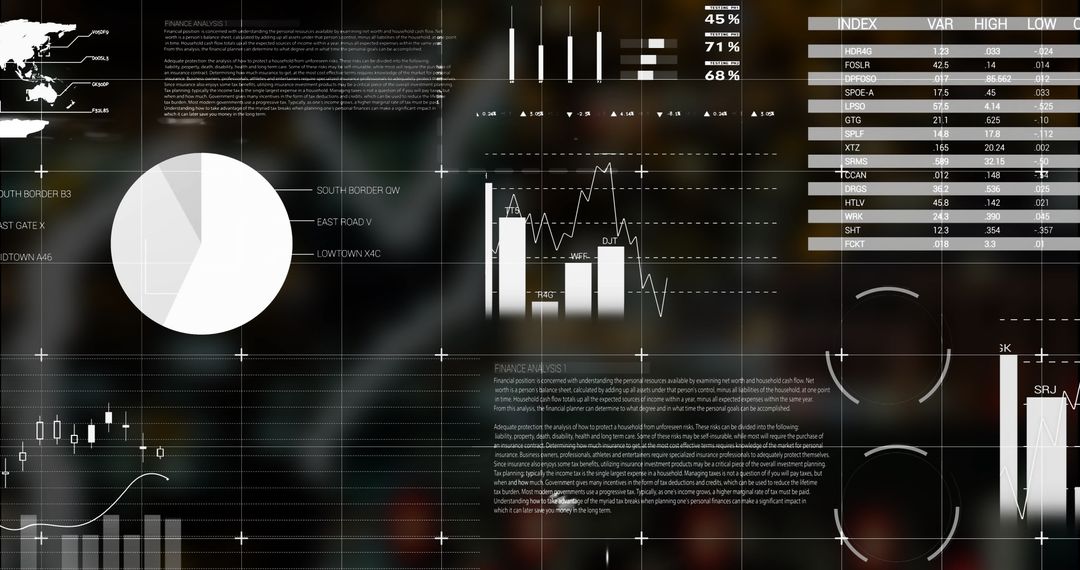
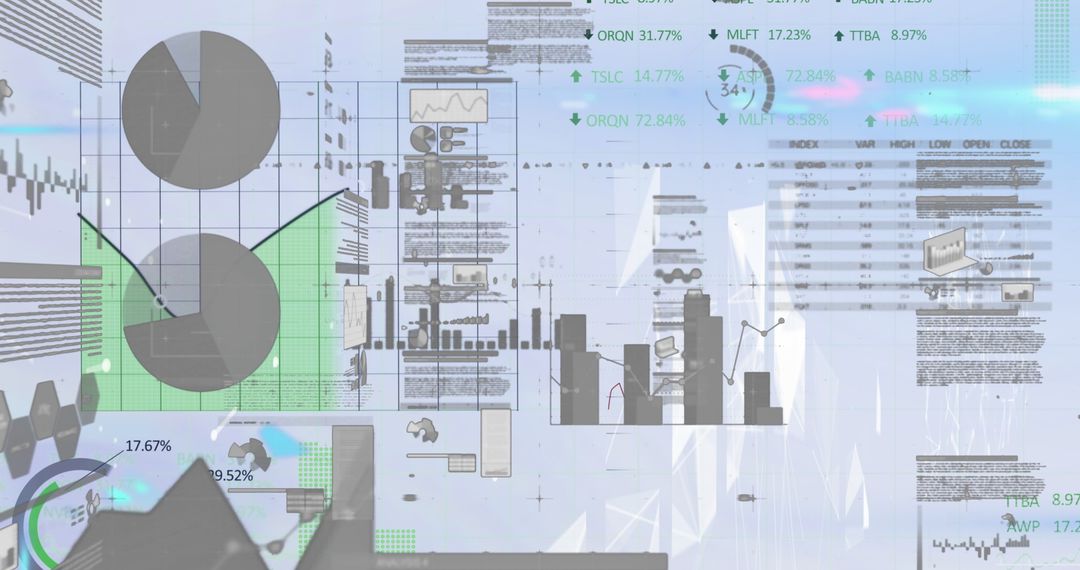
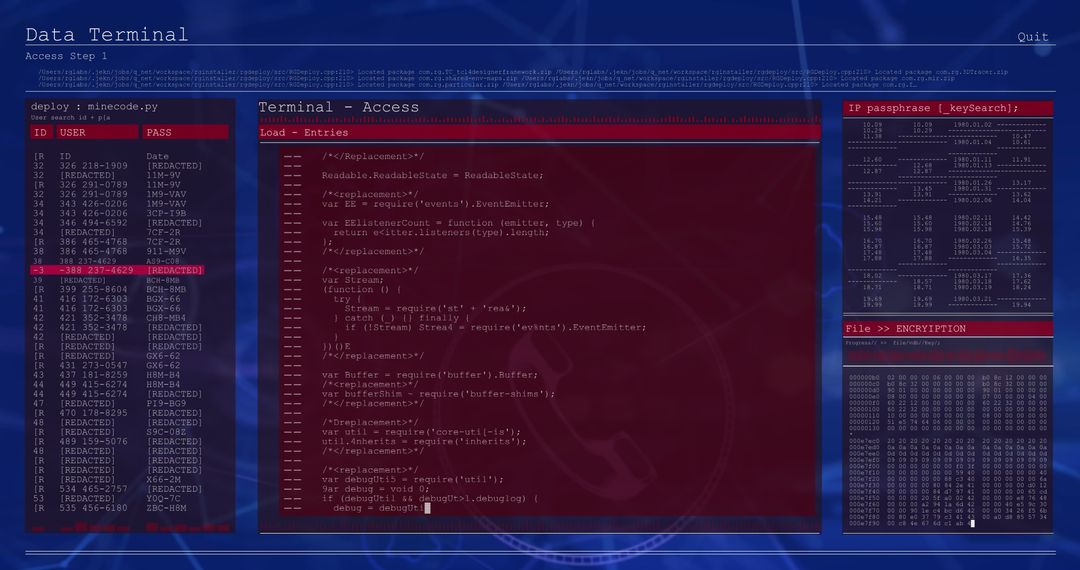
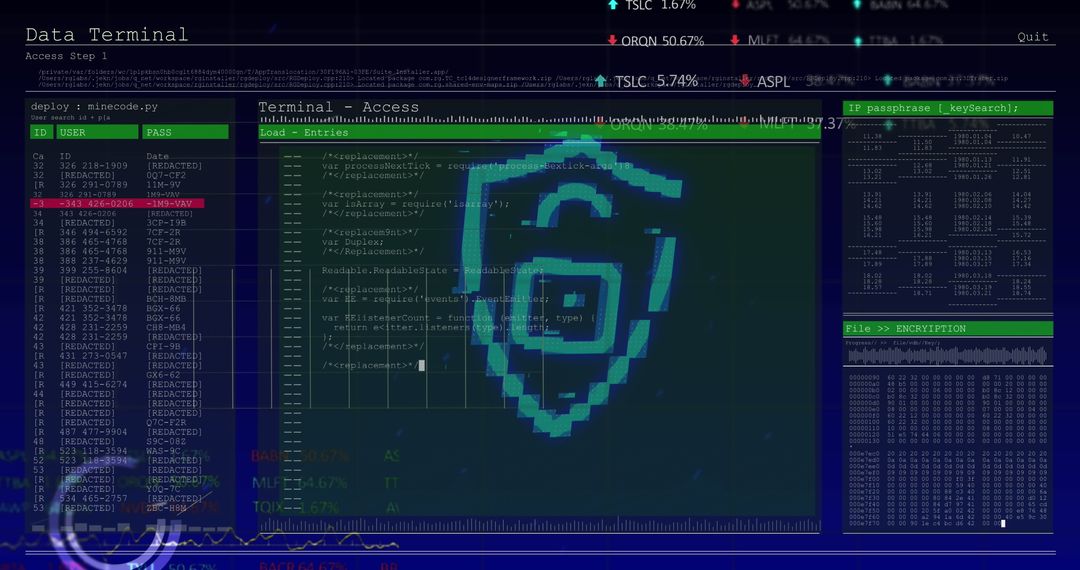
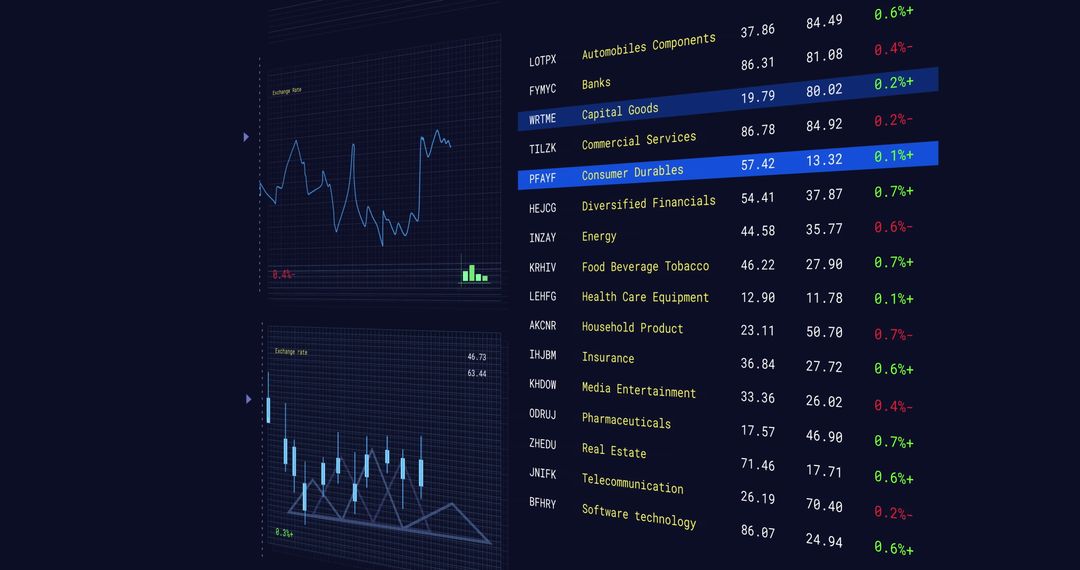
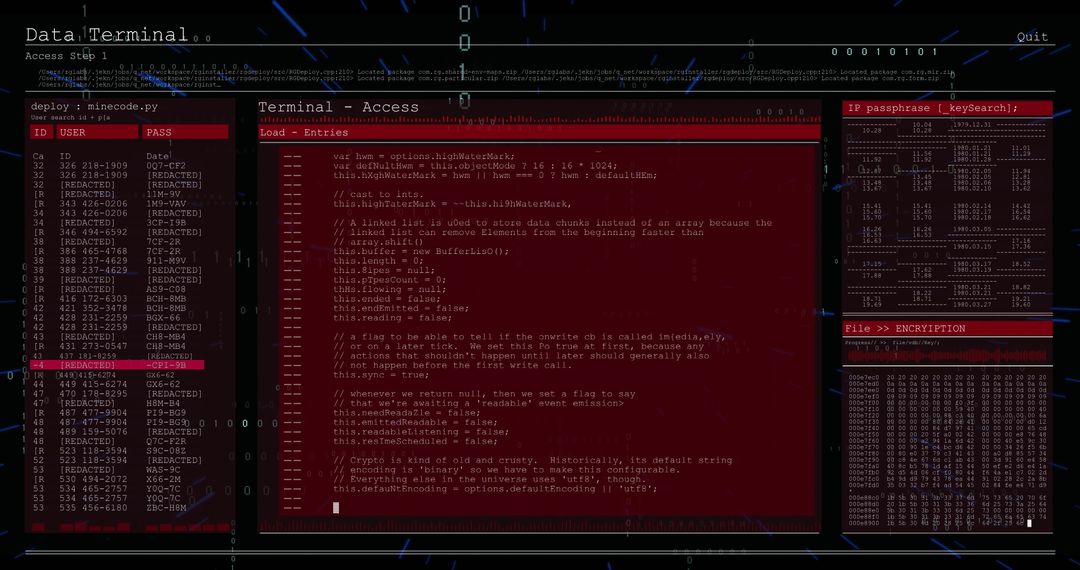
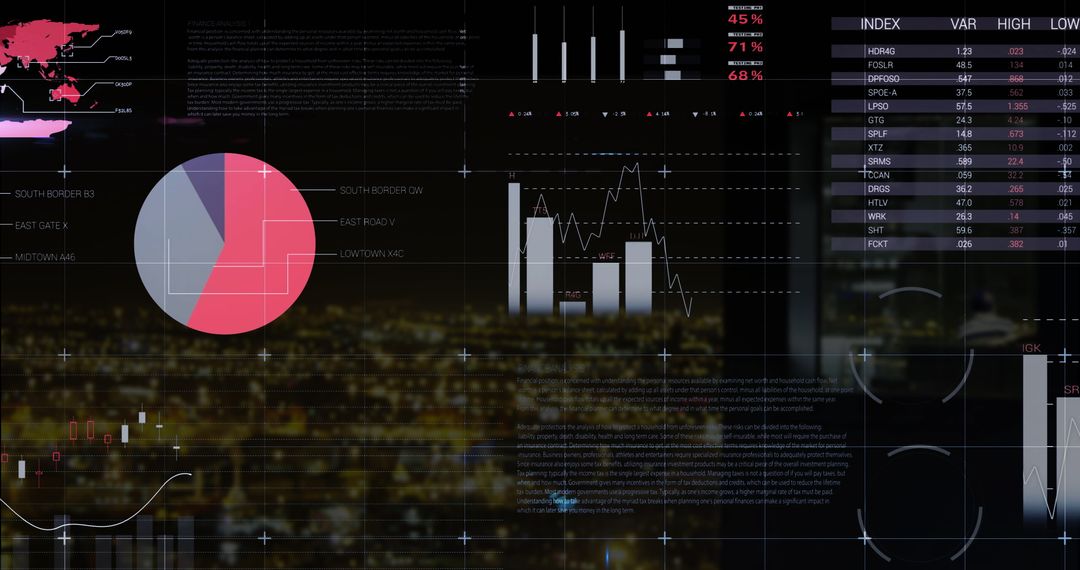
- Advanced Financial Analysis with Digital Charts and Graphs
Advanced Financial Analysis with Digital Charts and Graphs Image

Shows sophisticated financial charts and graphs used for analyzing market trends. Ideal for websites, presentations, or articles focusing on finance, data analysis, or economic strategy. Useful background for topics on financial technology investments and market predictions.
Powered by  - Get 15% off with code: PIKWIZARD15


2
downloads
downloads
Tags:
More
Credit Photo
If you would like to credit the Photo, here are some ways you can do so
Text Link
photo Link
<span class="text-link">
<span>
<a target="_blank" href=https://pikwizard.com/photo/advanced-financial-analysis-with-digital-charts-and-graphs/faceb48aee7cf8550d8b270bd7ea87cb/>PikWizard</a>
</span>
</span>
<span class="image-link">
<span
style="margin: 0 0 20px 0; display: inline-block; vertical-align: middle; width: 100%;"
>
<a
target="_blank"
href="https://pikwizard.com/photo/advanced-financial-analysis-with-digital-charts-and-graphs/faceb48aee7cf8550d8b270bd7ea87cb/"
style="text-decoration: none; font-size: 10px; margin: 0;"
>
<img src="https://pikwizard.com/pw/medium/faceb48aee7cf8550d8b270bd7ea87cb.jpg" style="margin: 0; width: 100%;" alt="" />
<p style="font-size: 12px; margin: 0;">PikWizard</p>
</a>
</span>
</span>
Free (free of charge)
Free for personal and commercial use.
Author: Creative Art
Similar Free Stock Images

Premium


Premium


Premium


Premium


Premium


Premium


Premium


Premium


Premium


Premium


Premium


Premium


Premium


Premium


Premium


Premium


Premium


Premium


Premium


Premium


Premium


Premium


Premium


Premium