- Home >
- Stock Photos >
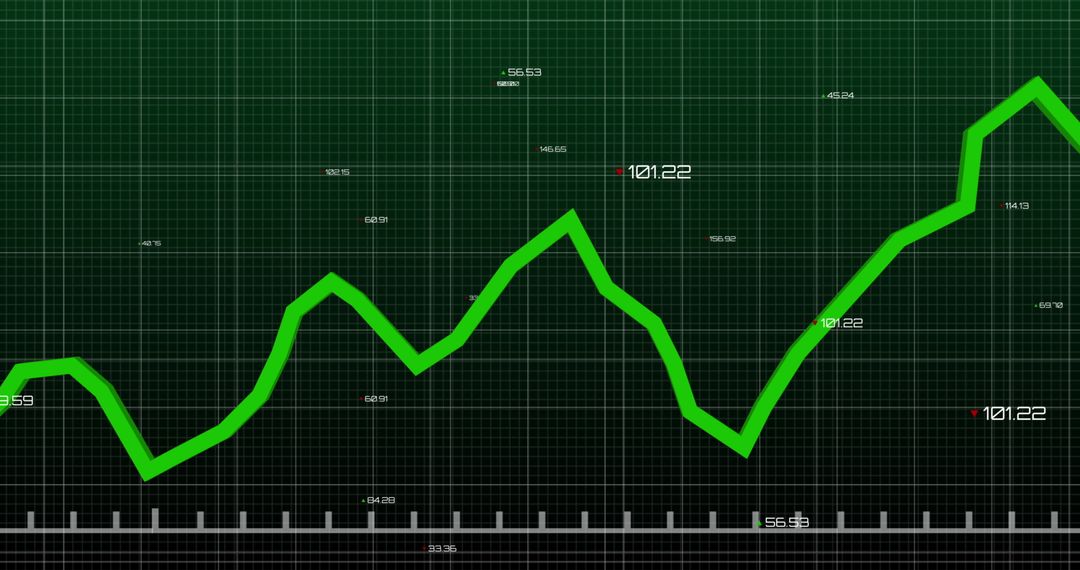
- Advanced Financial Charting with Zigzag Indicator and Trends
Advanced Financial Charting with Zigzag Indicator and Trends Image

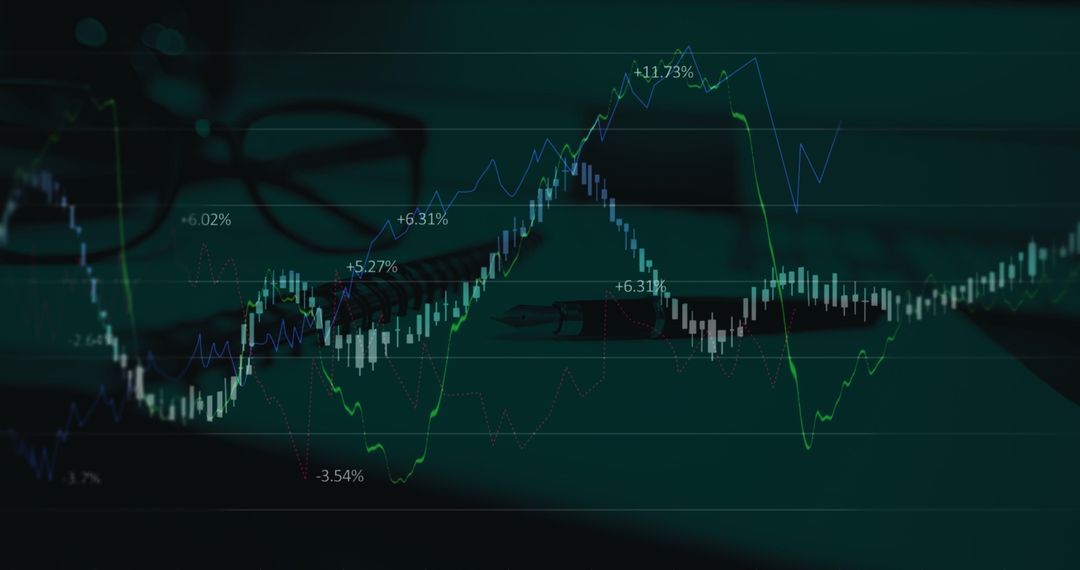
Digital illustration showing in-depth technical analysis elements in the green backdrop of a trading screen. The emphasis on vibrant pink zigzag lines highlights market volatility. Widely applicable for financial reports, investment strategy articles, trading blogs, and educational content on understanding market signals and forecasting trends.
Powered by  - Get 15% off with code: PIKWIZARD15

2
downloads
downloads
Tags:
More
Credit Photo
If you would like to credit the Photo, here are some ways you can do so
Text Link
photo Link
<span class="text-link">
<span>
<a target="_blank" href=https://pikwizard.com/photo/advanced-financial-charting-with-zigzag-indicator-and-trends/d70086835ce7e72501d2e58f711fcdcb/>PikWizard</a>
</span>
</span>
<span class="image-link">
<span
style="margin: 0 0 20px 0; display: inline-block; vertical-align: middle; width: 100%;"
>
<a
target="_blank"
href="https://pikwizard.com/photo/advanced-financial-charting-with-zigzag-indicator-and-trends/d70086835ce7e72501d2e58f711fcdcb/"
style="text-decoration: none; font-size: 10px; margin: 0;"
>
<img src="https://pikwizard.com/pw/medium/d70086835ce7e72501d2e58f711fcdcb.jpg" style="margin: 0; width: 100%;" alt="" />
<p style="font-size: 12px; margin: 0;">PikWizard</p>
</a>
</span>
</span>
Free (free of charge)
Free for personal and commercial use.
Author: People Creations
Similar Free Stock Images