- Home >
- Stock Photos >
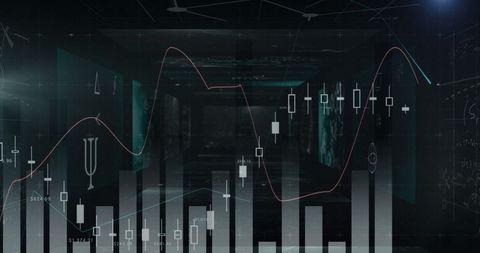
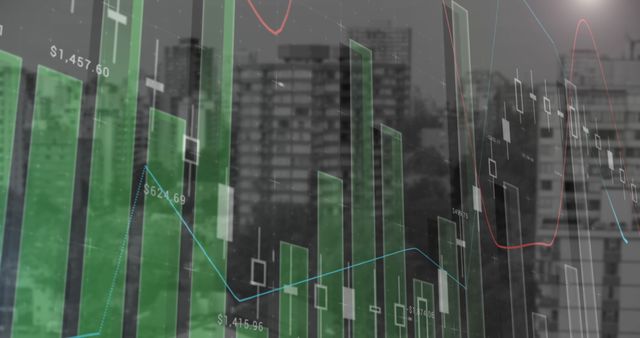
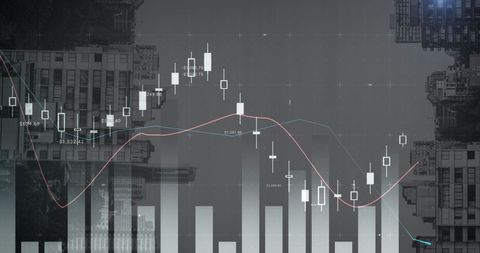
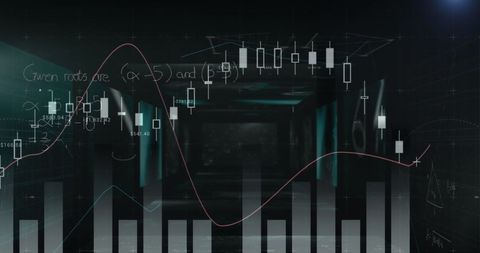
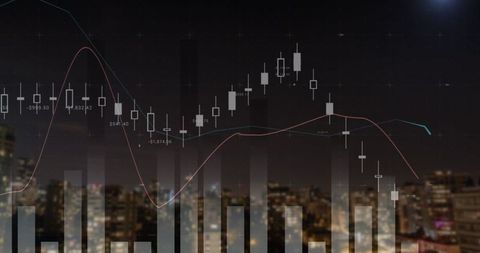
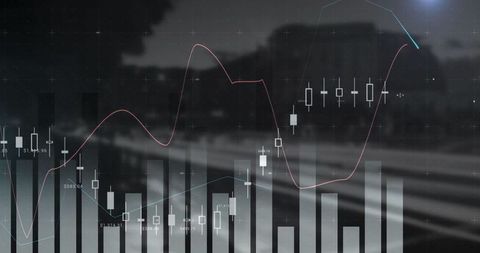
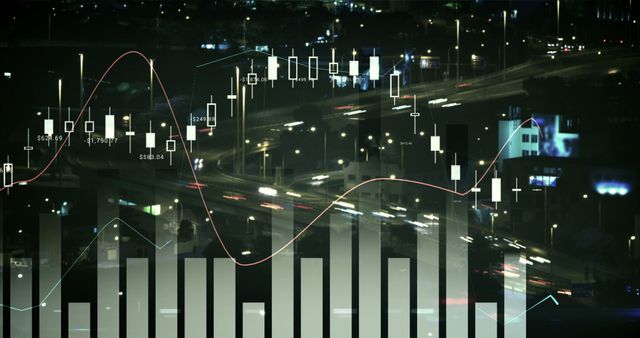
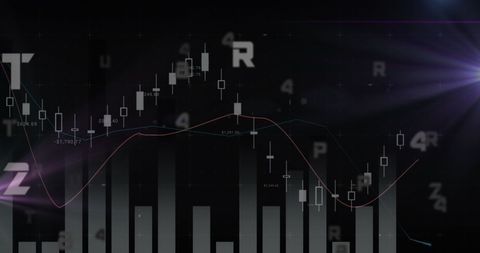
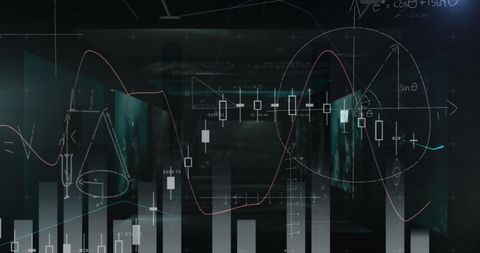
- Advanced Financial Data Analysis with Digital Graphs and Charts
Advanced Financial Data Analysis with Digital Graphs and Charts Image

Visual displaying close-up view of financial graphs and candlestick charts integrated with digital and futuristic elements. Provides an ideal resource for business presentations, educational material on stock market analysis, and technology-related content. Valuable for financial technology companies seeking innovative ways to illustrate economic trends and business strategies.
Powered by  - Get 15% off with code: PIKWIZARD15


downloads
Tags:
More
Credit Photo
If you would like to credit the Photo, here are some ways you can do so
Text Link
photo Link
<span class="text-link">
<span>
<a target="_blank" href=https://pikwizard.com/photo/advanced-financial-data-analysis-with-digital-graphs-and-charts/f57f63bb8943f4ee82d7fa8c4579f27b/>PikWizard</a>
</span>
</span>
<span class="image-link">
<span
style="margin: 0 0 20px 0; display: inline-block; vertical-align: middle; width: 100%;"
>
<a
target="_blank"
href="https://pikwizard.com/photo/advanced-financial-data-analysis-with-digital-graphs-and-charts/f57f63bb8943f4ee82d7fa8c4579f27b/"
style="text-decoration: none; font-size: 10px; margin: 0;"
>
<img src="https://pikwizard.com/pw/medium/f57f63bb8943f4ee82d7fa8c4579f27b.jpg" style="margin: 0; width: 100%;" alt="" />
<p style="font-size: 12px; margin: 0;">PikWizard</p>
</a>
</span>
</span>
Free (free of charge)
Free for personal and commercial use.
Author: Creative Art
Similar Free Stock Images
Loading...

Premium


Premium


Premium


Premium

Premium


Premium

Premium


Premium


Premium


Premium

Premium


Premium

Premium


Premium


Premium


Premium

Premium


Premium


Premium

Premium


Premium


Premium

Premium


Premium

Premium