
- Home >
- Stock Photos >
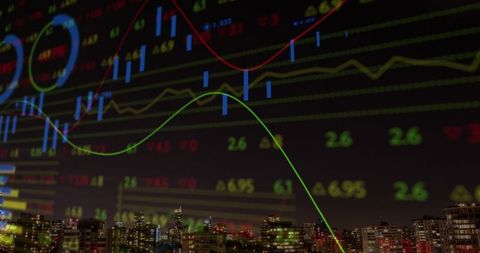
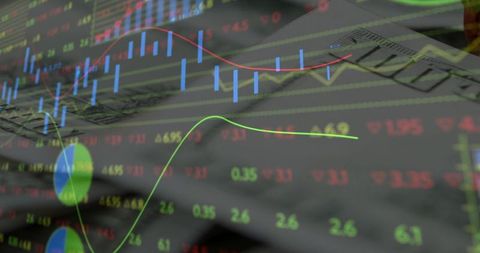
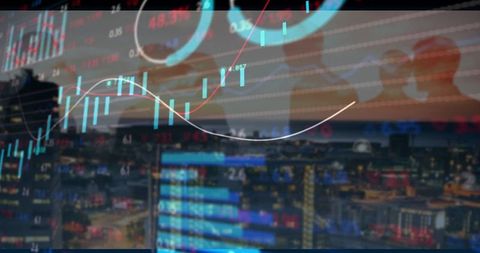
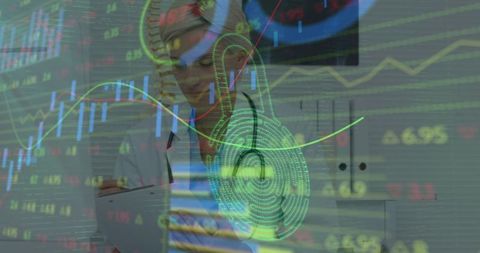
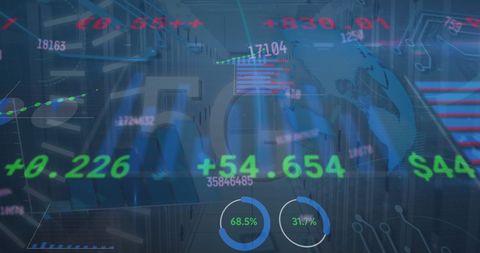
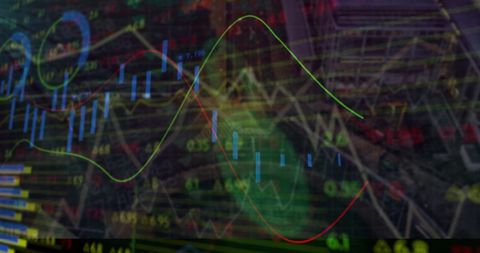
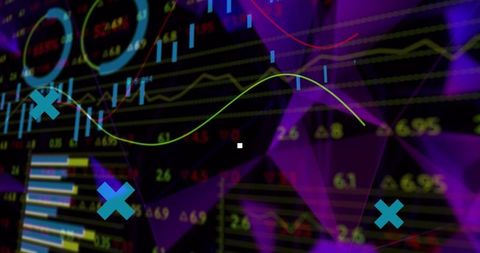
- Advanced Financial Data Analytics Visualization on Trading Dashboard
Advanced Financial Data Analytics Visualization on Trading Dashboard Image

This image presents a futuristic trading dashboard with various dynamic financial graphs, charts, and numeric tickers that might be displayed in analytics software. It is suitable for financial firms, investment companies, tech journals, educational materials on stocks and economic data analysis. The overlay of data makes it adaptable for articles or presentations on technological advancements in financial markets.
Powered by 


downloads
Tags:
More
Credit Photo
If you would like to credit the Photo, here are some ways you can do so
Text Link
photo Link
<span class="text-link">
<span>
<a target="_blank" href=https://pikwizard.com/photo/advanced-financial-data-analytics-visualization-on-trading-dashboard/c9b7e54ef09cb1bd2047e6ee7032c696/>PikWizard</a>
</span>
</span>
<span class="image-link">
<span
style="margin: 0 0 20px 0; display: inline-block; vertical-align: middle; width: 100%;"
>
<a
target="_blank"
href="https://pikwizard.com/photo/advanced-financial-data-analytics-visualization-on-trading-dashboard/c9b7e54ef09cb1bd2047e6ee7032c696/"
style="text-decoration: none; font-size: 10px; margin: 0;"
>
<img src="https://pikwizard.com/pw/medium/c9b7e54ef09cb1bd2047e6ee7032c696.jpg" style="margin: 0; width: 100%;" alt="" />
<p style="font-size: 12px; margin: 0;">PikWizard</p>
</a>
</span>
</span>
Free (free of charge)
Free for personal and commercial use.
Author: Awesome Content
Similar Free Stock Images

Premium

Premium


Premium

Premium

Premium


Premium


Premium


Premium

Premium

Premium


Premium


Premium


Premium


Premium


Premium


Premium


Premium


Premium


Premium

Premium


Premium


Premium

Premium

Premium


Premium


Explore More Free Stock Images