- Home >
- Stock Photos >
- Advanced Financial Data Processing Chart Visualization
Advanced Financial Data Processing Chart Visualization Image

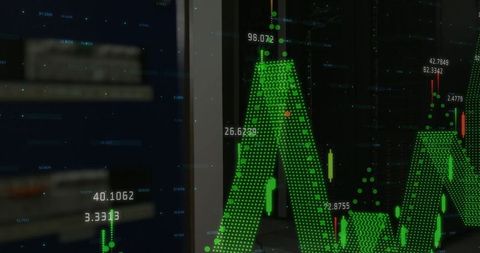
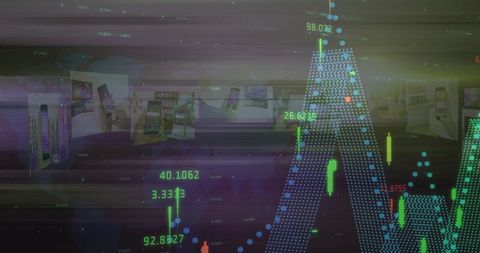
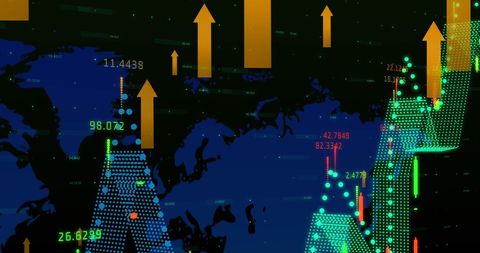
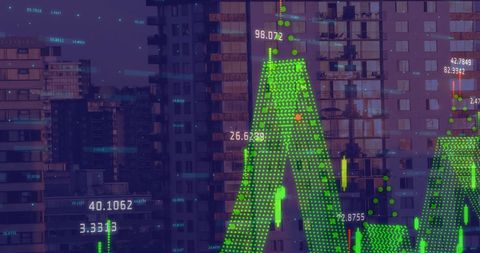
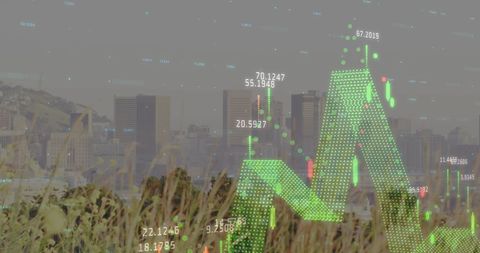
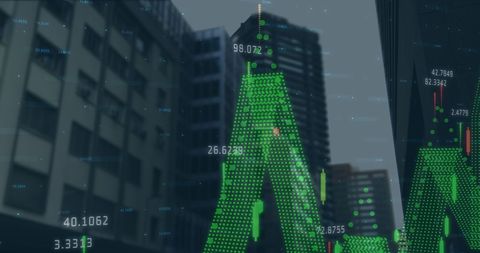
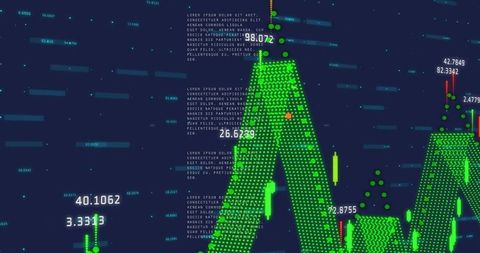
Detailed visualization depicting financial data processing against a black background. Includes intricate charts, digital data points, and these elements could represent trends in global business and market analysis. Ideal for illustrating economic trends, business intelligence, or financial case studies.

downloads
Tags:
More
Credit Photo
If you would like to credit the Photo, here are some ways you can do so
Text Link
photo Link
<span class="text-link">
<span>
<a target="_blank" href=https://pikwizard.com/photo/advanced-financial-data-processing-chart-visualization/a2459c0a75df91e4493ec9cef550944e/>PikWizard</a>
</span>
</span>
<span class="image-link">
<span
style="margin: 0 0 20px 0; display: inline-block; vertical-align: middle; width: 100%;"
>
<a
target="_blank"
href="https://pikwizard.com/photo/advanced-financial-data-processing-chart-visualization/a2459c0a75df91e4493ec9cef550944e/"
style="text-decoration: none; font-size: 10px; margin: 0;"
>
<img src="https://pikwizard.com/pw/medium/a2459c0a75df91e4493ec9cef550944e.jpg" style="margin: 0; width: 100%;" alt="" />
<p style="font-size: 12px; margin: 0;">PikWizard</p>
</a>
</span>
</span>
Free (free of charge)
Free for personal and commercial use.
Author: People Creations