
- Home >
- Stock Photos >
- Advanced Financial Data Visualization on Digital Dashboard
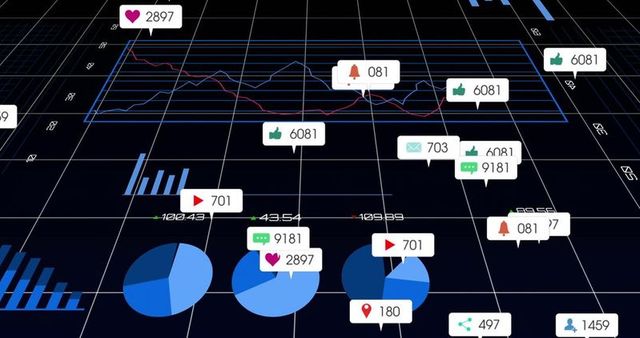
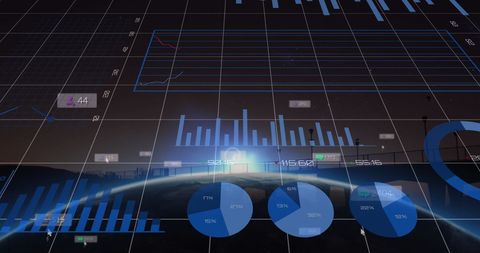
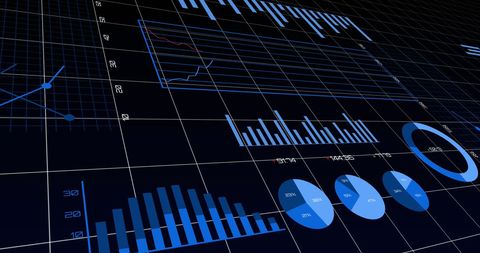
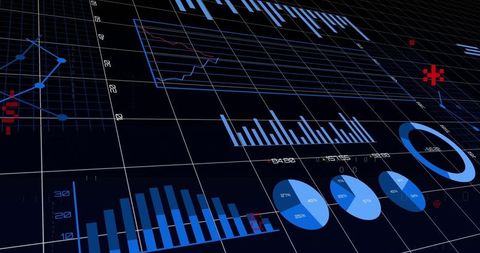
Advanced Financial Data Visualization on Digital Dashboard Image
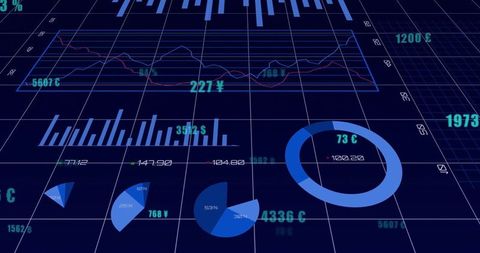
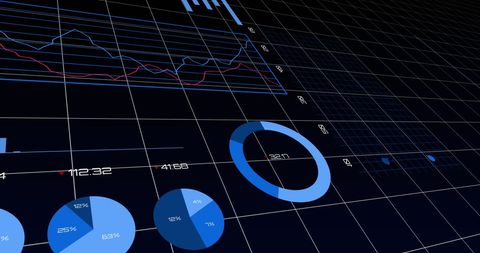
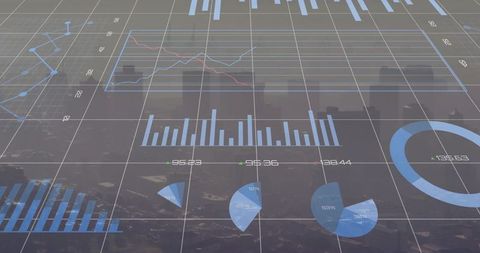
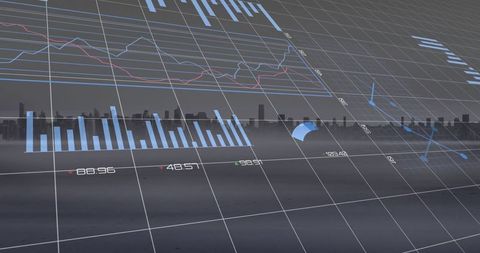
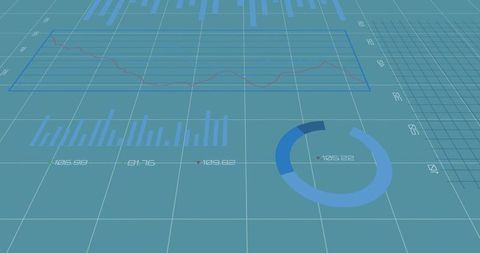
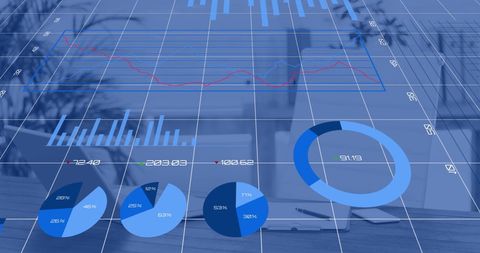
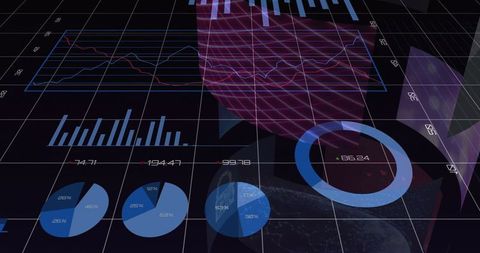
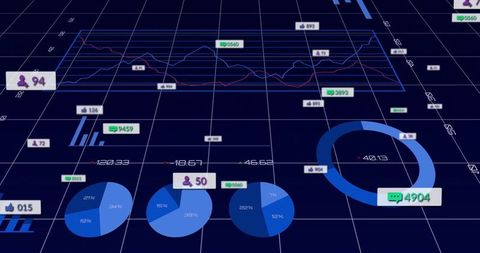
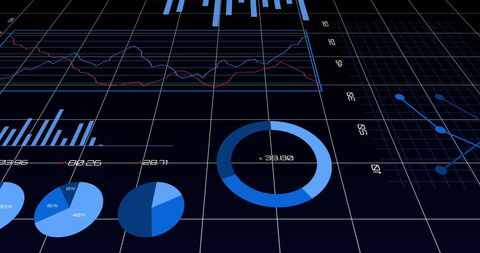
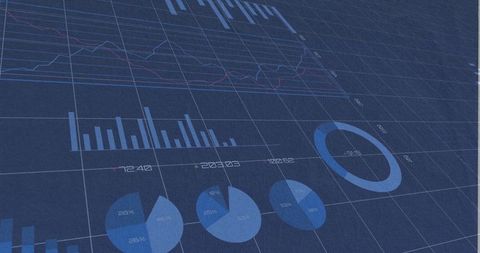
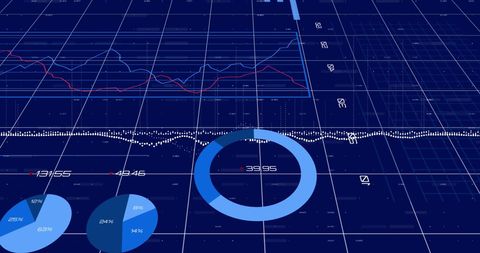
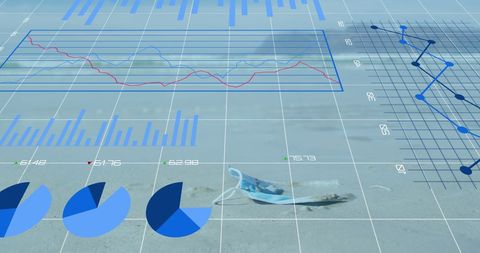
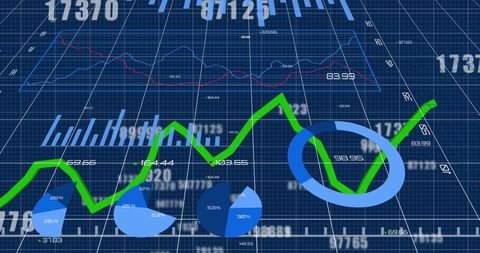
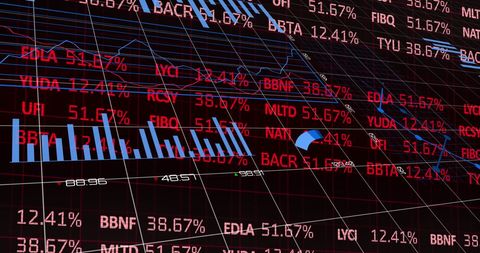
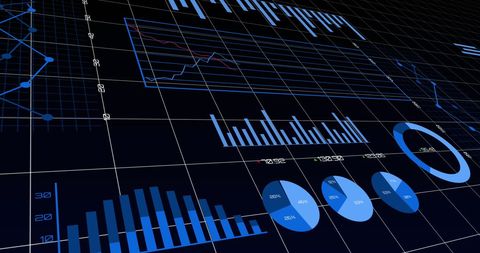
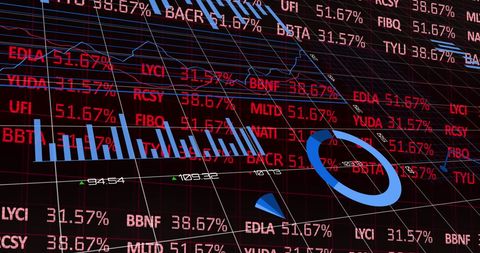
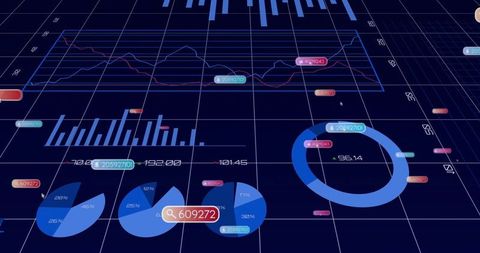
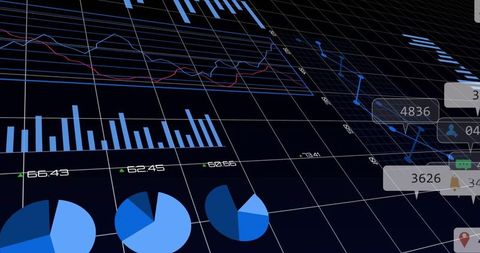
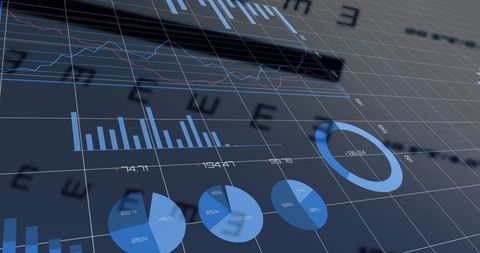
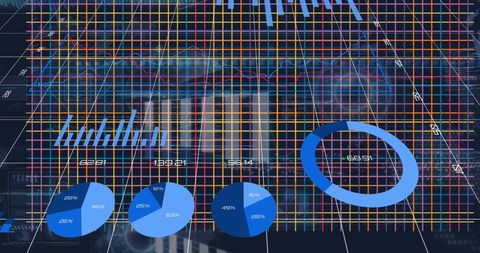
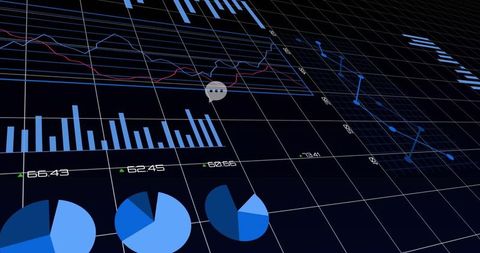
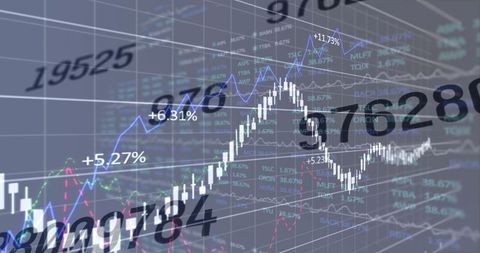
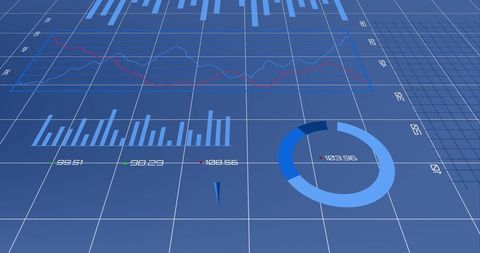
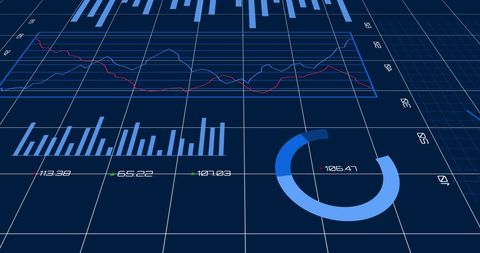
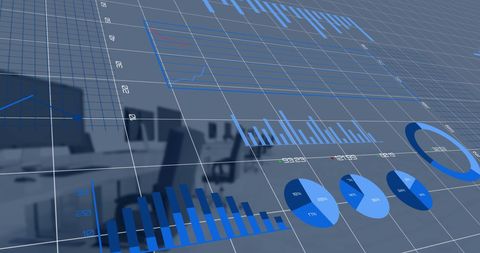
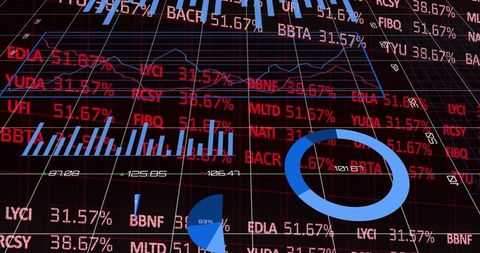
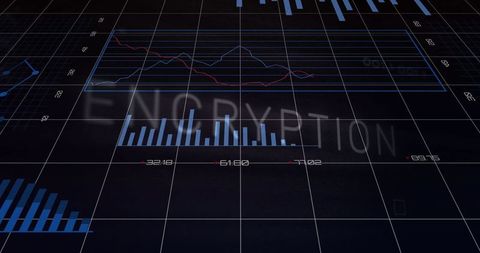
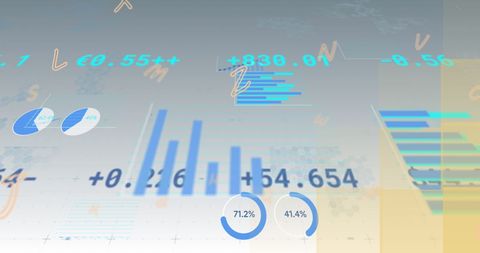
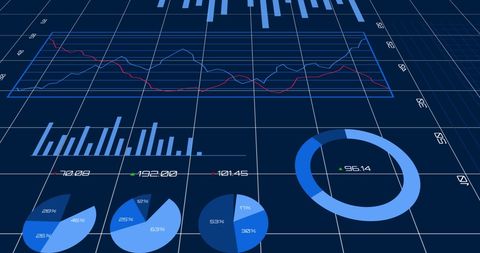
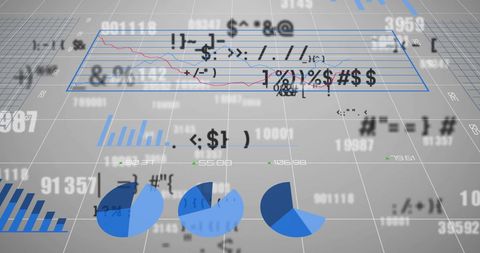
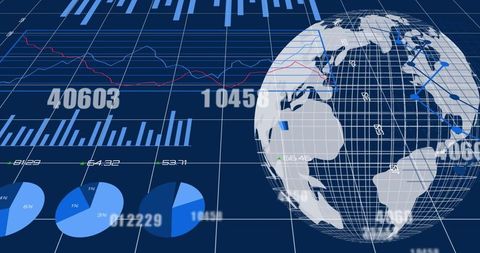
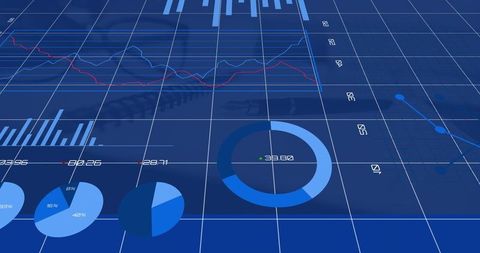
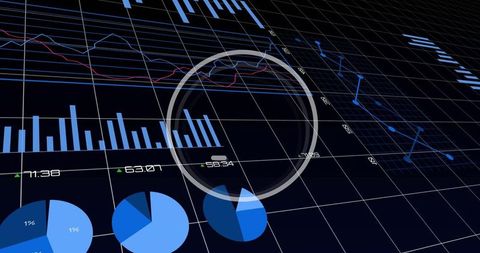
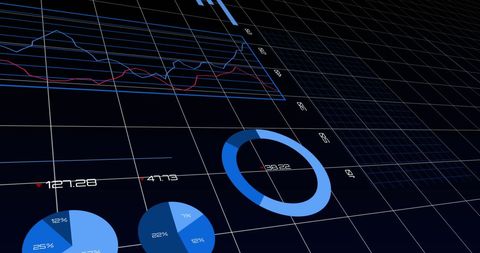
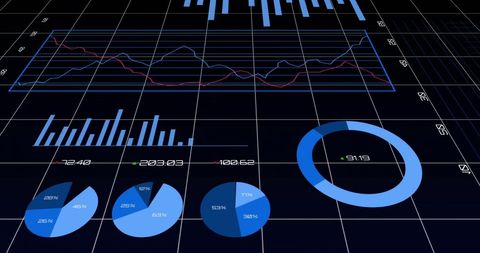
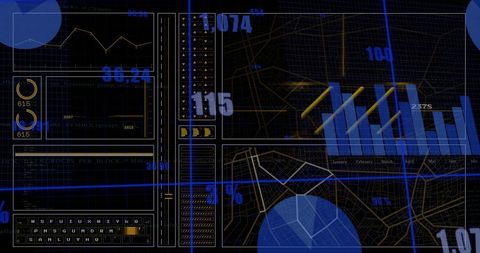
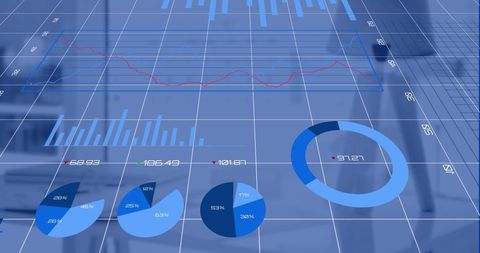
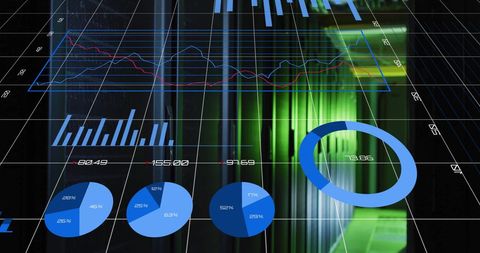
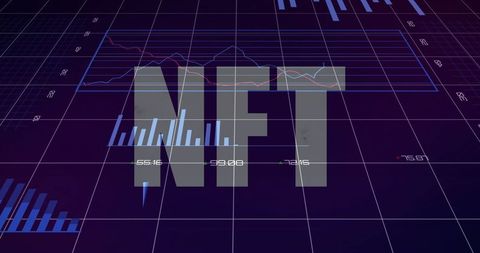
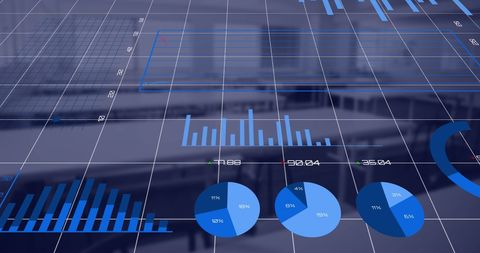
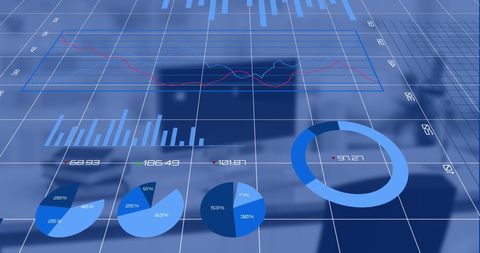
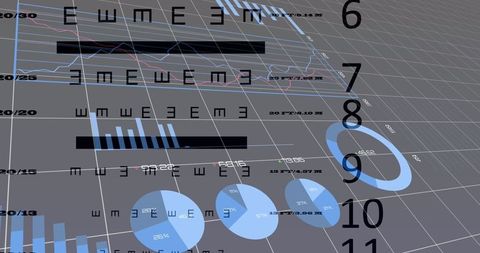
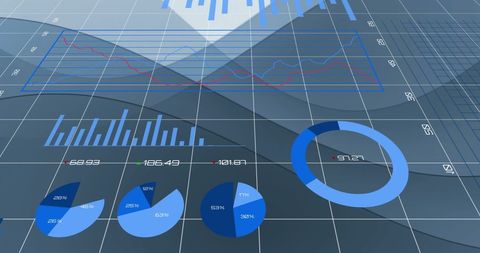
This digital representation of a financial dashboard showcases various types of data through bar charts, line graphs, and pie charts, all set against a 3D grid background. The smooth integration of complex data creates a sense of advanced technology and futurism. Perfect for use in presentations about financial analytics, fintech solutions, or economic strategy sessions. The dynamic visual elements can also enhance reports or digital content focused on market analysis and investment strategies.
Powered by 


downloads
Tags:
More
Credit Photo
If you would like to credit the Photo, here are some ways you can do so
Text Link
photo Link
<span class="text-link">
<span>
<a target="_blank" href=https://pikwizard.com/photo/advanced-financial-data-visualization-on-digital-dashboard/0ac7d70547dc08b28fc96f1f79e96b83/>PikWizard</a>
</span>
</span>
<span class="image-link">
<span
style="margin: 0 0 20px 0; display: inline-block; vertical-align: middle; width: 100%;"
>
<a
target="_blank"
href="https://pikwizard.com/photo/advanced-financial-data-visualization-on-digital-dashboard/0ac7d70547dc08b28fc96f1f79e96b83/"
style="text-decoration: none; font-size: 10px; margin: 0;"
>
<img src="https://pikwizard.com/pw/medium/0ac7d70547dc08b28fc96f1f79e96b83.jpg" style="margin: 0; width: 100%;" alt="" />
<p style="font-size: 12px; margin: 0;">PikWizard</p>
</a>
</span>
</span>
Free (free of charge)
Free for personal and commercial use.
Author: Awesome Content
Similar Free Stock Images
Premium

Premium


Premium


Premium


Premium


Premium


Premium


Premium

Premium


Premium


Premium


Premium


Premium

Premium

Premium


Premium


Premium


Premium


Premium


Premium


Premium


Premium


Premium


Premium


Premium


Explore More Free Stock Images