
- Home >
- Stock Photos >
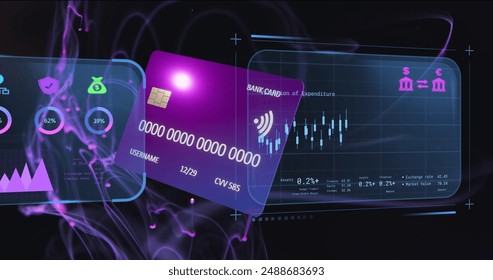
- Advanced Financial Data Visualization on Digital Interface
Advanced Financial Data Visualization on Digital Interface Image

Dynamic display of financial metrics and data charts offering insights into business performance and trends. Ideal for use in financial technology presentations, economic forecasts, and corporate analytics reports.
Powered by  - Get 15% off with code: PIKWIZARD15


downloads
Tags:
More
Credit Photo
If you would like to credit the Photo, here are some ways you can do so
Text Link
photo Link
<span class="text-link">
<span>
<a target="_blank" href=https://pikwizard.com/photo/advanced-financial-data-visualization-on-digital-interface/e4d78d27a0043efd15a578f3ff96ea6f/>PikWizard</a>
</span>
</span>
<span class="image-link">
<span
style="margin: 0 0 20px 0; display: inline-block; vertical-align: middle; width: 100%;"
>
<a
target="_blank"
href="https://pikwizard.com/photo/advanced-financial-data-visualization-on-digital-interface/e4d78d27a0043efd15a578f3ff96ea6f/"
style="text-decoration: none; font-size: 10px; margin: 0;"
>
<img src="https://pikwizard.com/pw/medium/e4d78d27a0043efd15a578f3ff96ea6f.jpg" style="margin: 0; width: 100%;" alt="" />
<p style="font-size: 12px; margin: 0;">PikWizard</p>
</a>
</span>
</span>
Free (free of charge)
Free for personal and commercial use.
Author: People Creations
Similar Free Stock Images

Premium


Premium

Premium


Premium


Premium


Premium


Premium


Premium


Premium

Premium


Premium


Premium


Premium


Premium


Premium


Premium


Premium


Premium


Premium


Premium


Premium


Premium


Premium


Premium


Premium


Explore More Free Stock Images