- Home >
- Stock Photos >
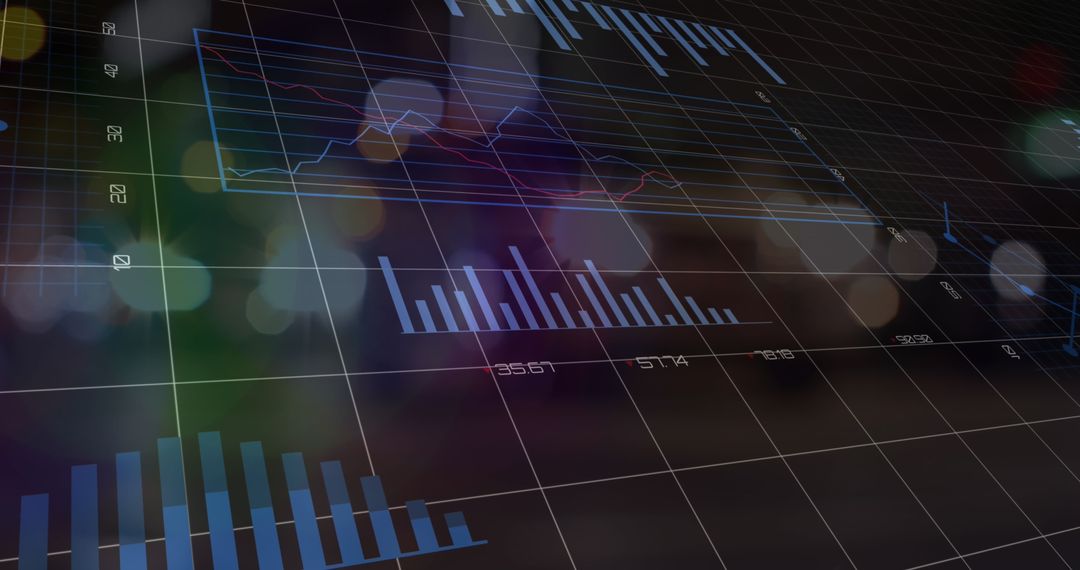
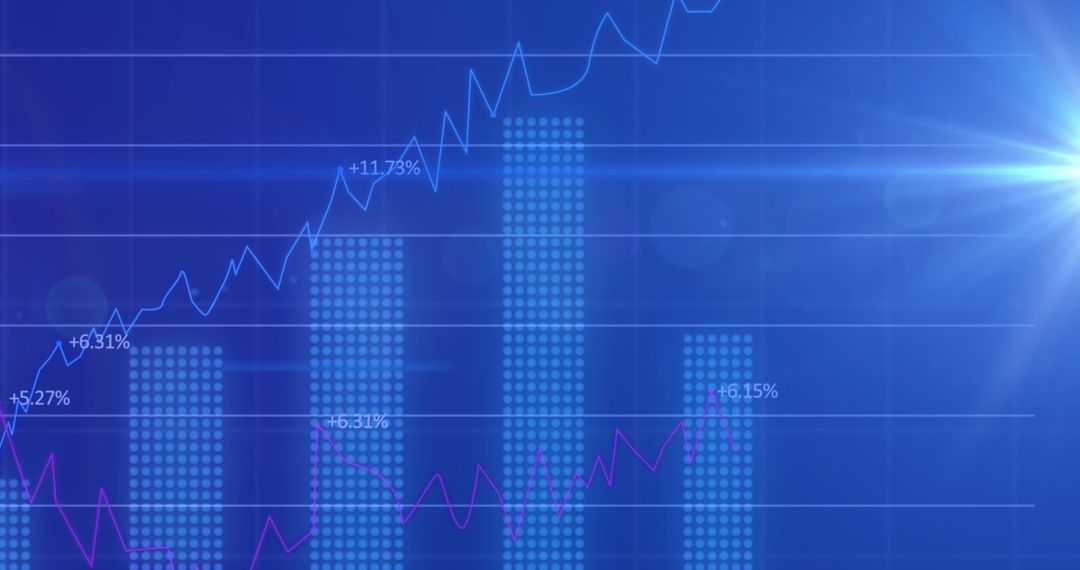
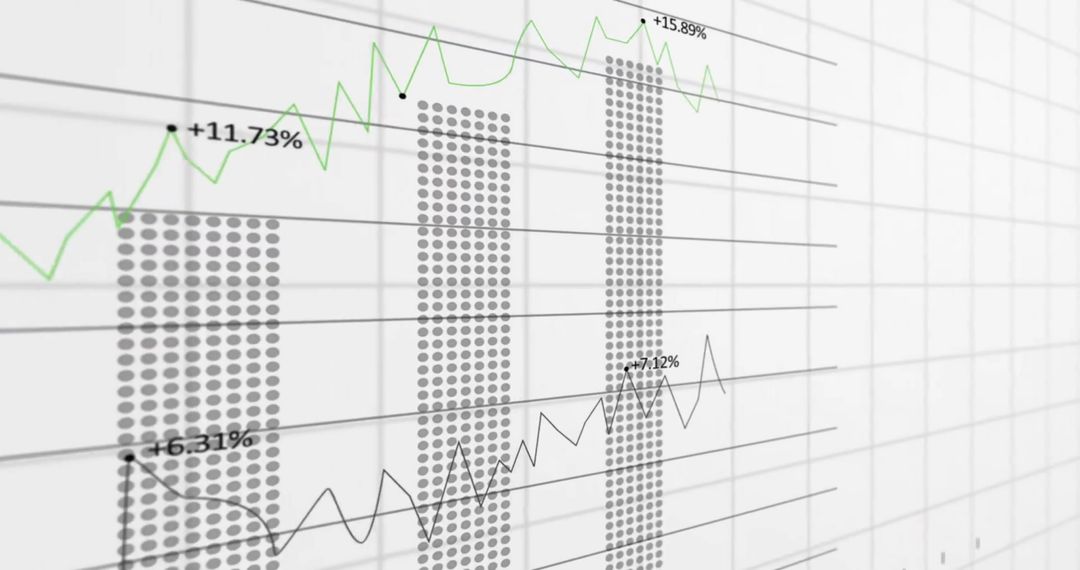
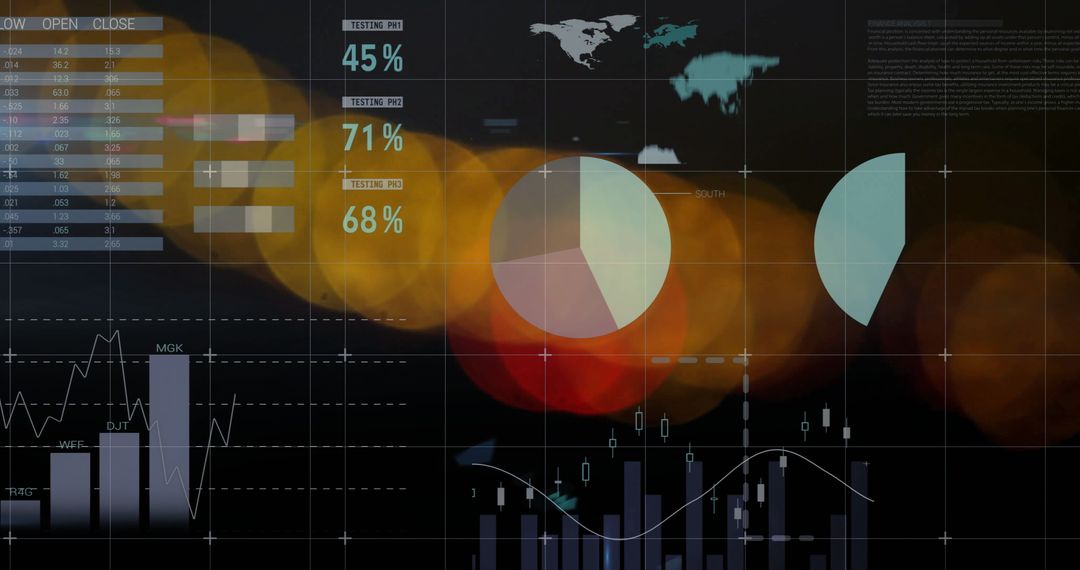
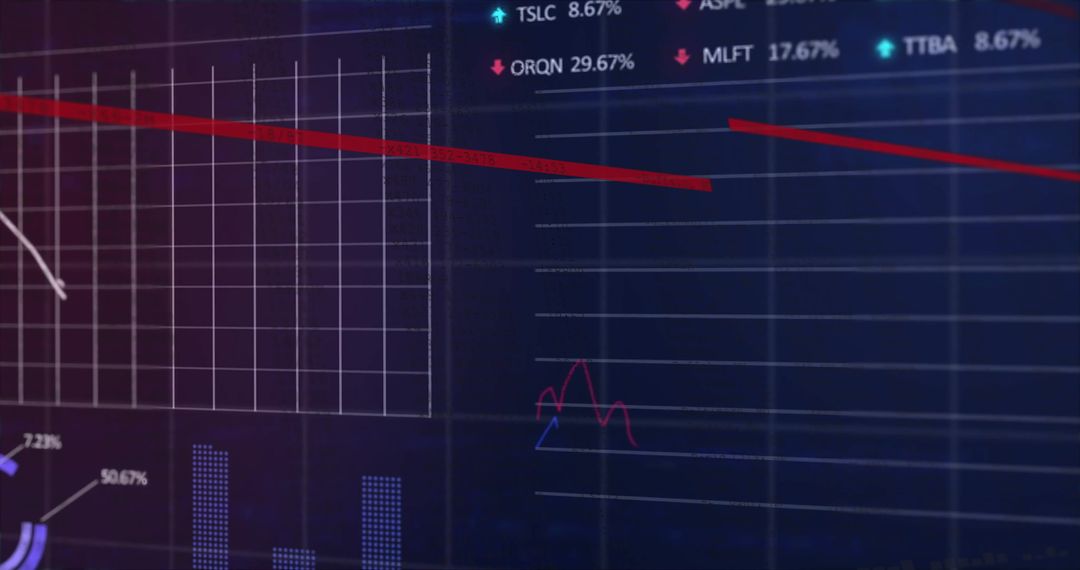
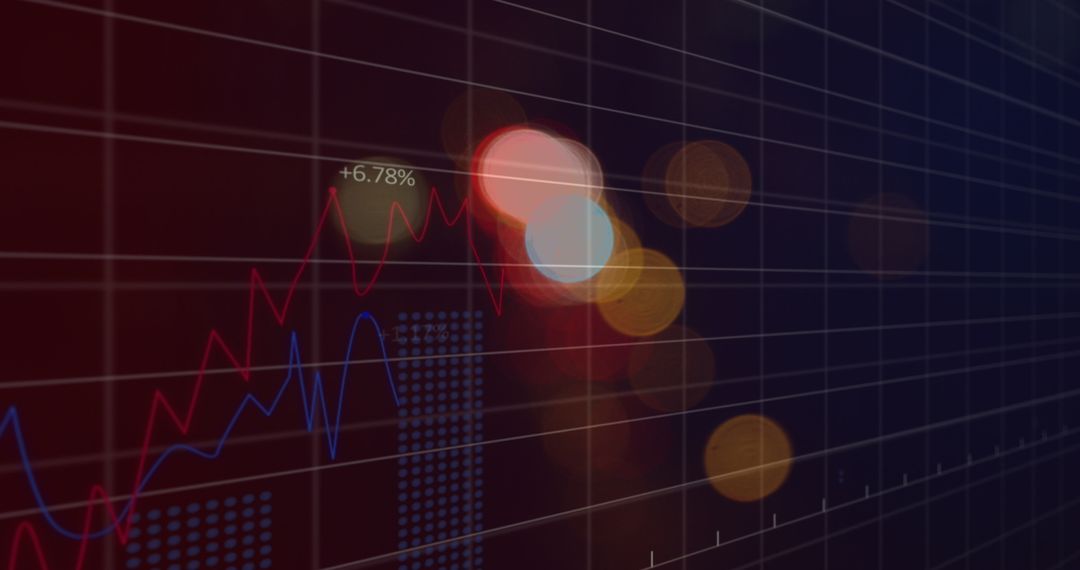
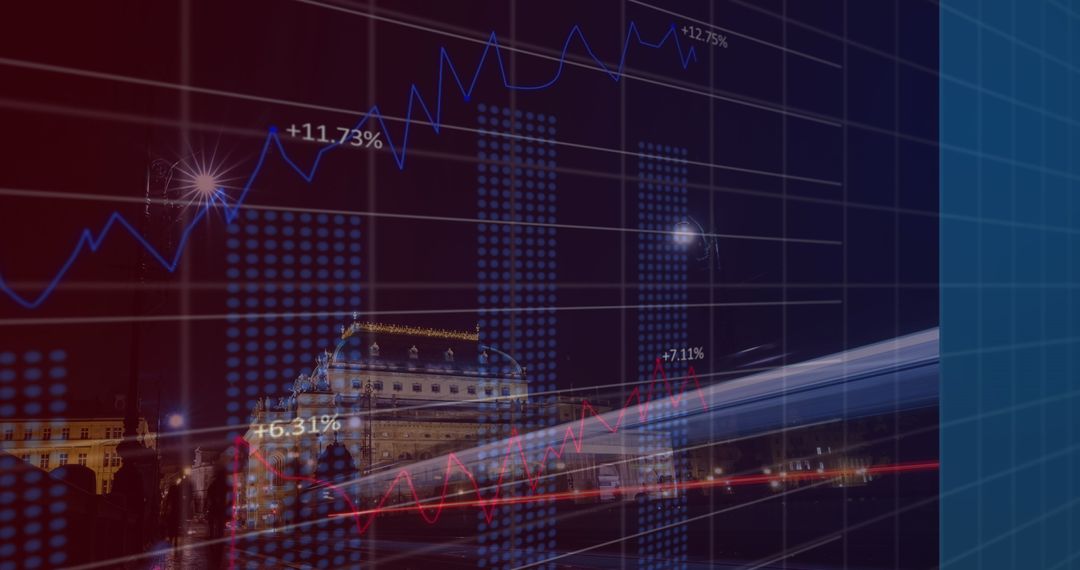
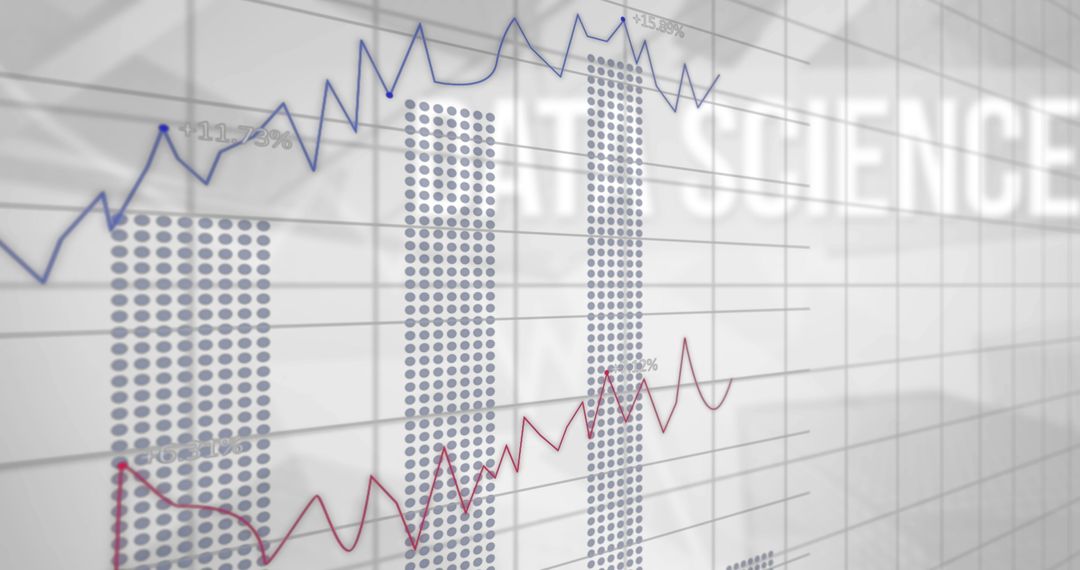
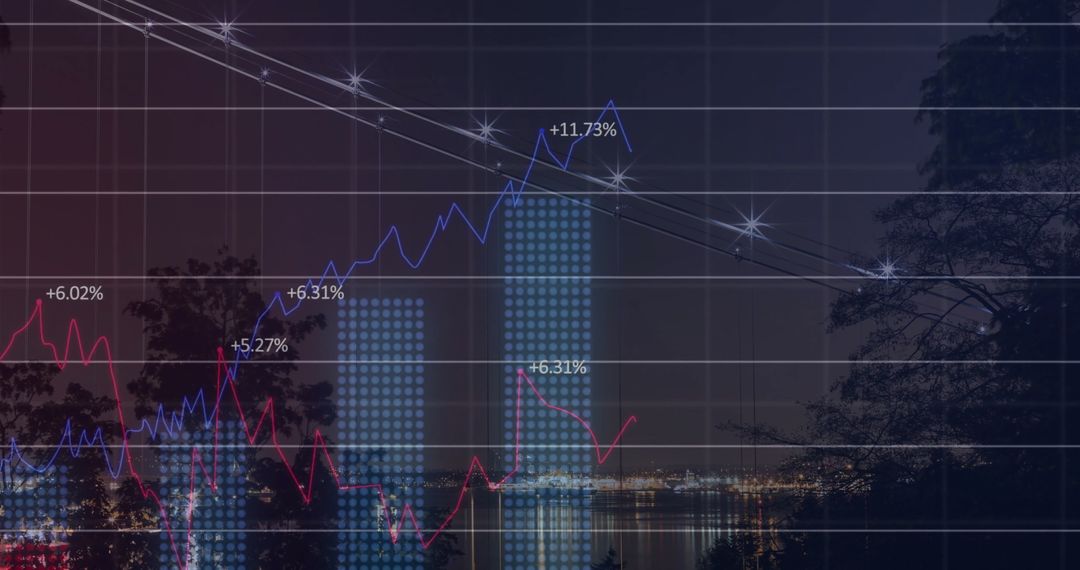
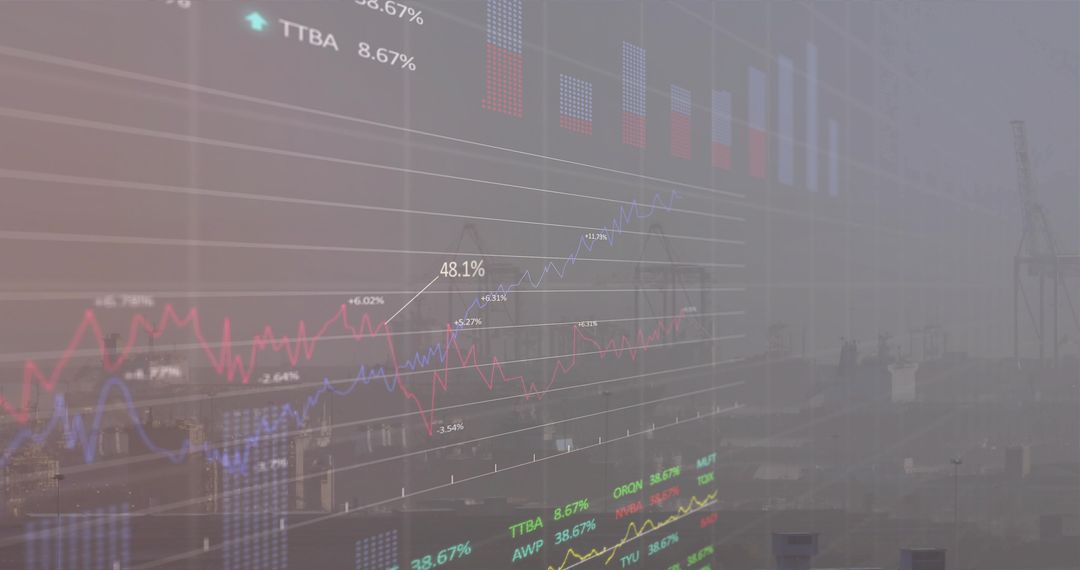
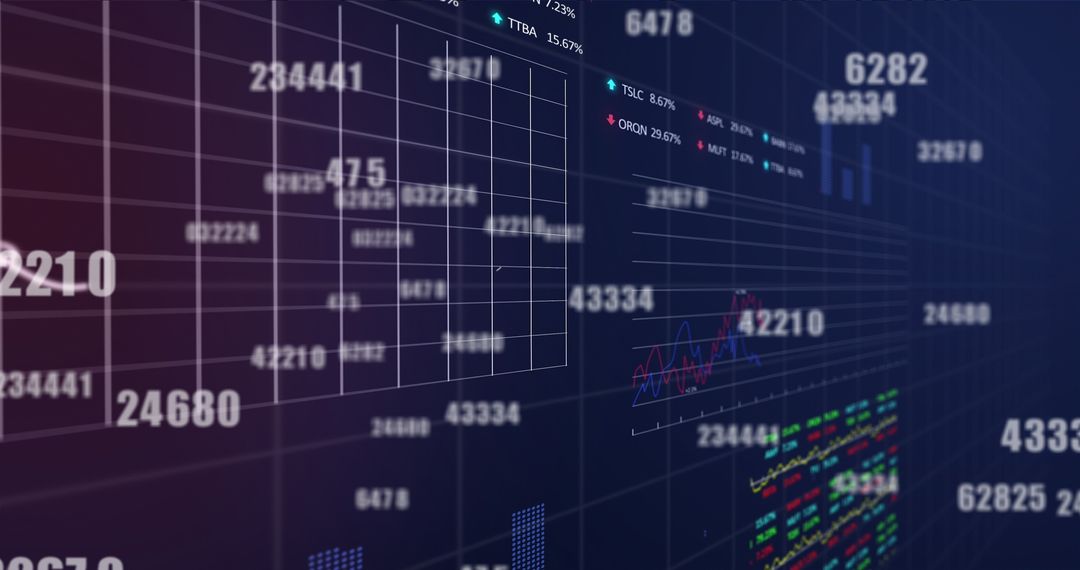
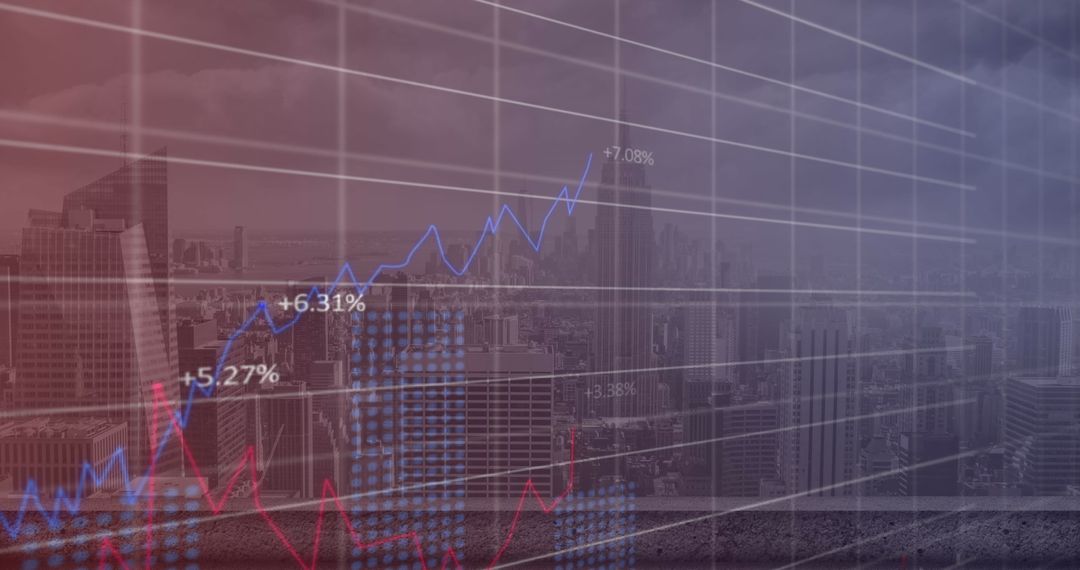
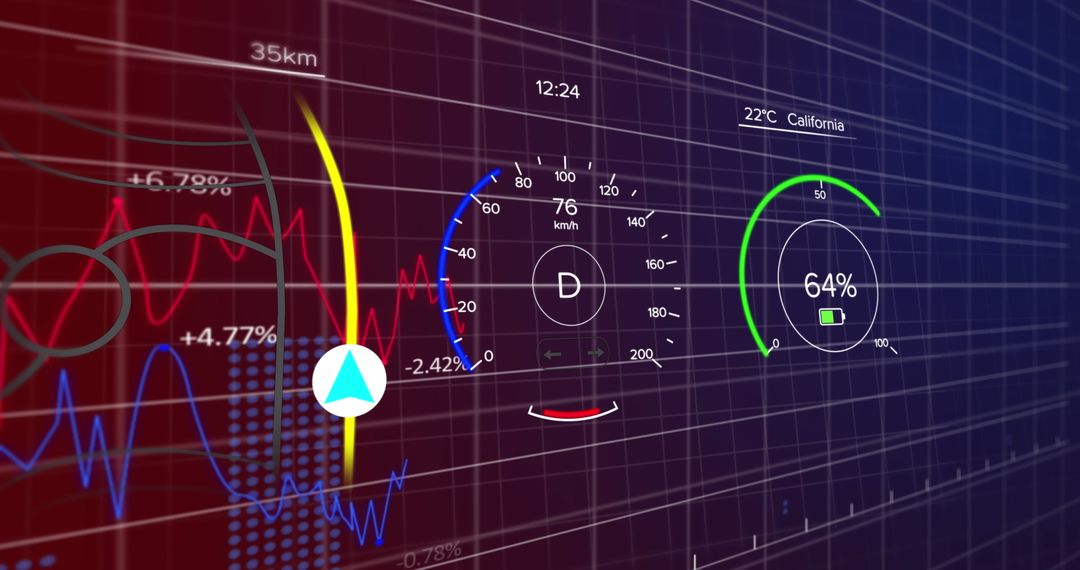
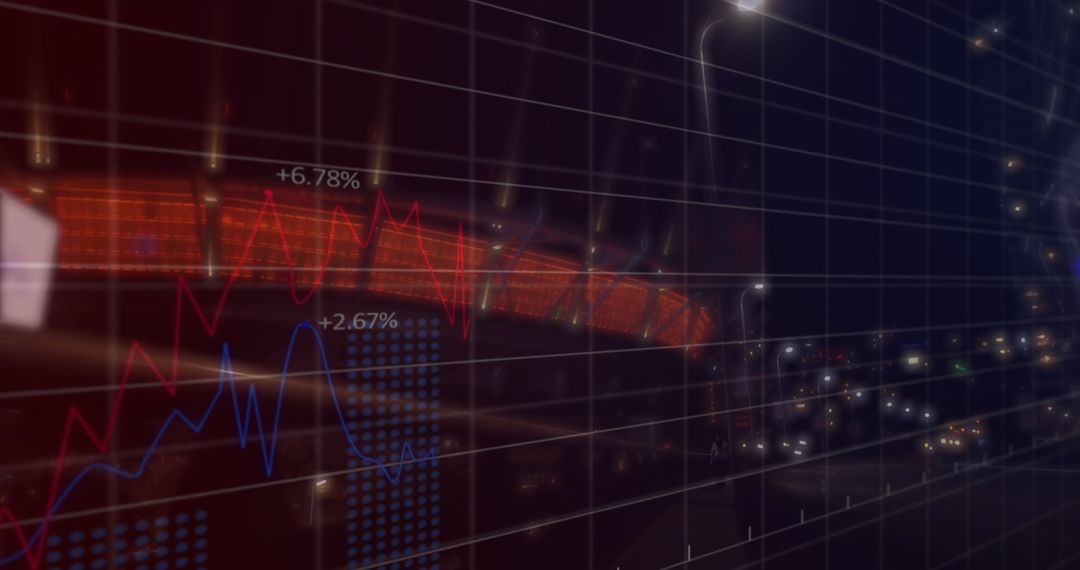
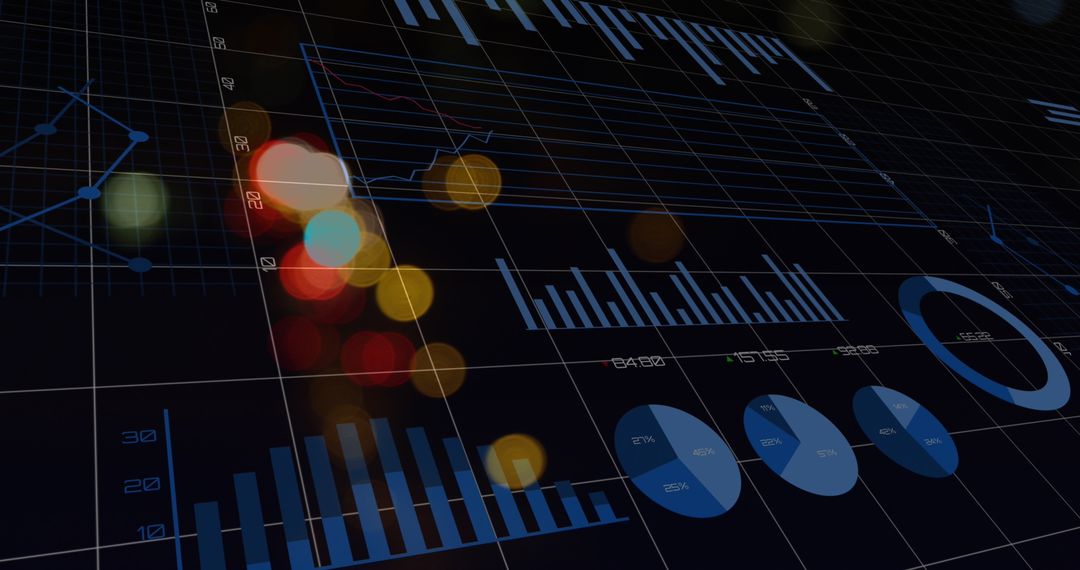
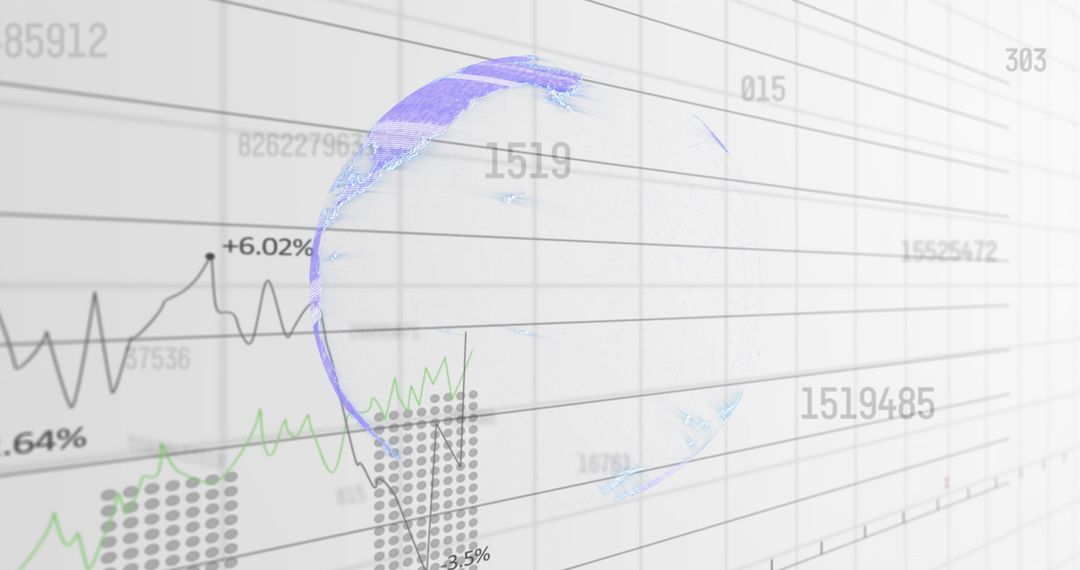
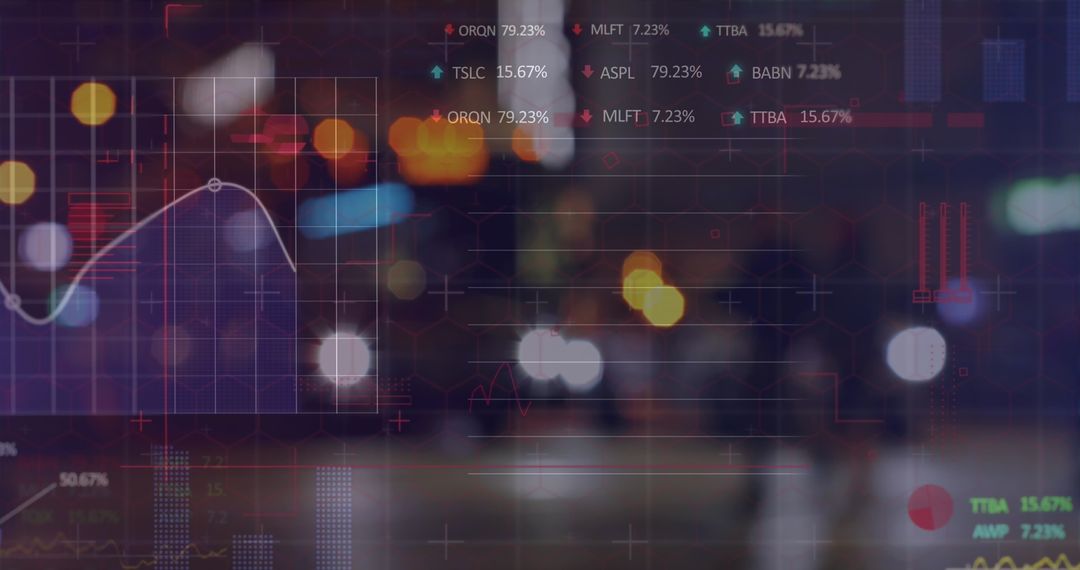
- Analysis of Financial Data with Graph Trends and Bokeh Lights
Analysis of Financial Data with Graph Trends and Bokeh Lights Image
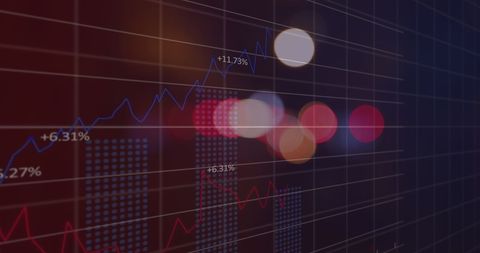
Abstract visualization of financial or economic data, perfect for illustrating technical reports, business websites, or marketing materials. Growing trend indicates success and positive outcomes. Bokeh lights create dynamic contrast, adding depth and focus. Useful for financial firms, investment products, and economic forecasts.
Powered by  - Get 15% off with code: PIKWIZARD15


2
downloads
downloads
Tags:
More
Credit Photo
If you would like to credit the Photo, here are some ways you can do so
Text Link
photo Link
<span class="text-link">
<span>
<a target="_blank" href=https://pikwizard.com/photo/analysis-of-financial-data-with-graph-trends-and-bokeh-lights/8bb2b62d75cc850590ca27a458571b9a/>PikWizard</a>
</span>
</span>
<span class="image-link">
<span
style="margin: 0 0 20px 0; display: inline-block; vertical-align: middle; width: 100%;"
>
<a
target="_blank"
href="https://pikwizard.com/photo/analysis-of-financial-data-with-graph-trends-and-bokeh-lights/8bb2b62d75cc850590ca27a458571b9a/"
style="text-decoration: none; font-size: 10px; margin: 0;"
>
<img src="https://pikwizard.com/pw/medium/8bb2b62d75cc850590ca27a458571b9a.jpg" style="margin: 0; width: 100%;" alt="" />
<p style="font-size: 12px; margin: 0;">PikWizard</p>
</a>
</span>
</span>
Free (free of charge)
Free for personal and commercial use.
Author: Awesome Content
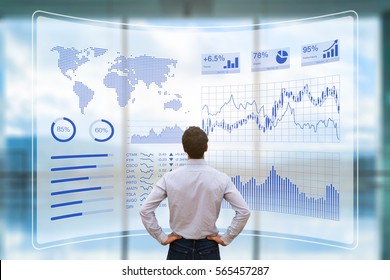
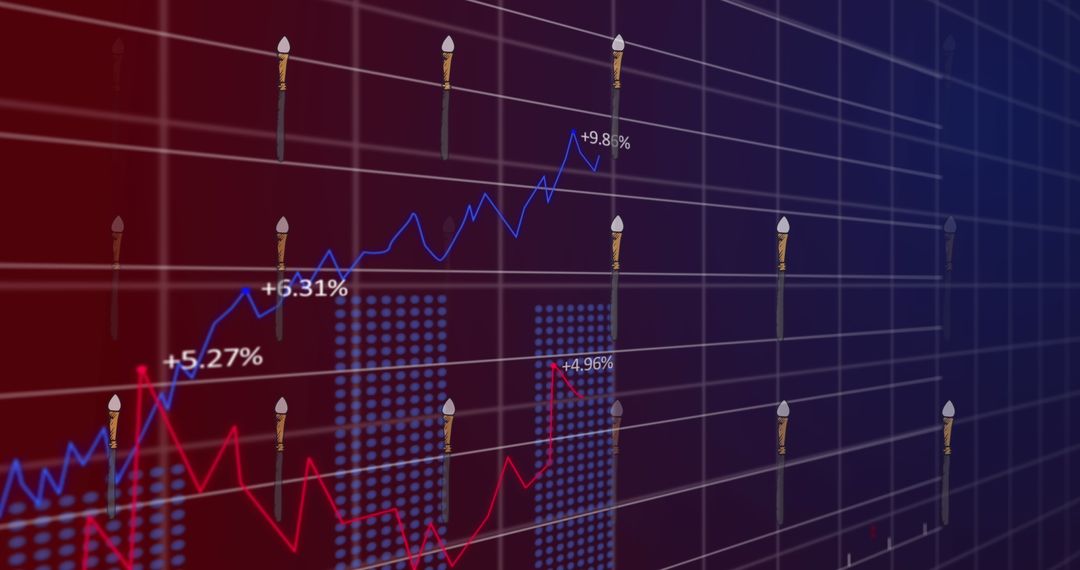
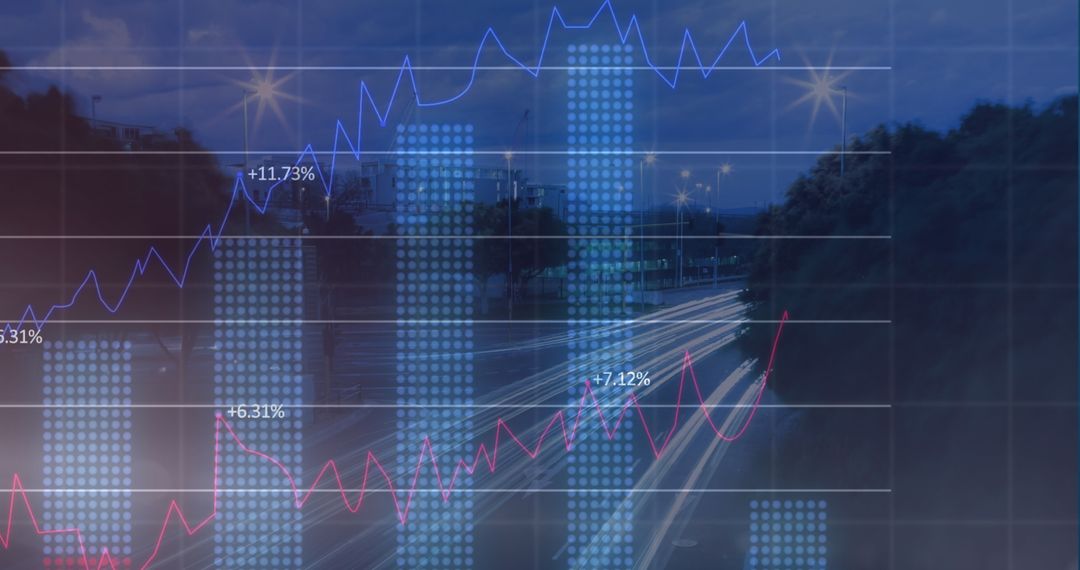
Similar Free Stock Images

Premium


Premium


Premium

Premium


Premium


Premium


Premium


Premium


Premium


Premium


Premium


Premium


Premium


Premium


Premium


Premium


Premium


Premium


Premium


Premium


Premium


Premium


Premium


Premium