- Home >
- Stock Photos >
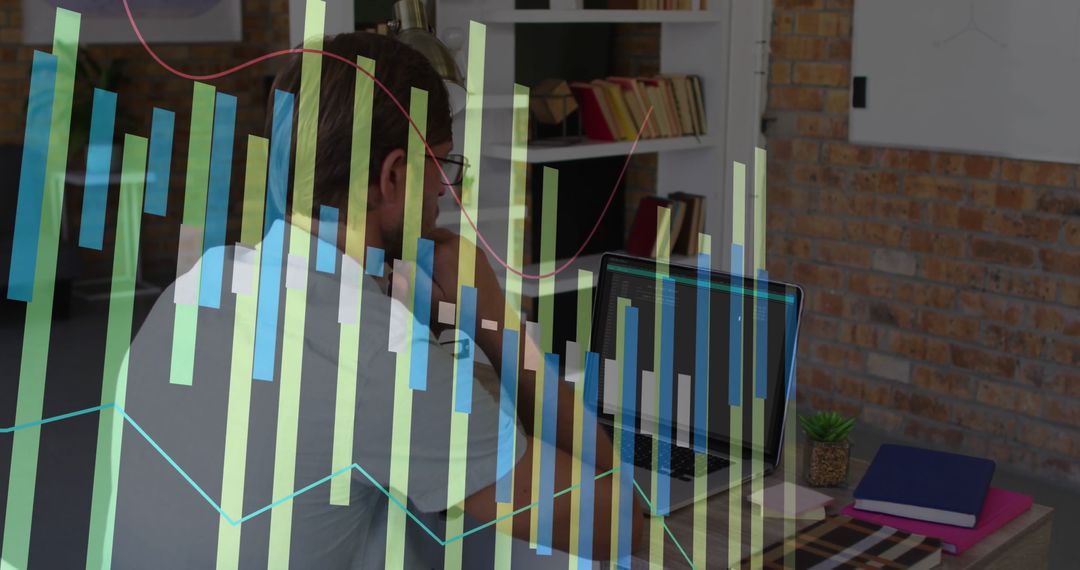
- Analyst studying market downturn on laptop with red downward arrow and data charts
Analyst studying market downturn on laptop with red downward arrow and data charts Image

Man wearing light shirt and glasses is studying laptop screen while red downward arrow and translucent charts are overlaying workspace to represent market decline and financial analytics. Composition is conveying concern and urgency, with muted tones and visible bar graphs and line plot tracking falling values. Foreground is showing laptop with data and desk accessories, background is featuring bookshelf and brick wall providing organic work vibe. Composition is offering negative space on right for headline or overlay text. Use cases include illustrating market volatility, showing investment risk, supporting stock market loss stories, enhancing recession analysis, accompanying financial newsletters, strengthening investor presentations, complementing corporate reports, enriching economics blog posts, promoting fintech marketing, highlighting analytics dashboards, and supporting training materials. Suggestions for customization include applying color grade to emphasize red tones, adding headline and data callouts in negative space, cropping for banner or social post formats, and overlaying brand elements.
Powered by 


0
downloads
downloads
Tags:
More
Credit Photo
If you would like to credit the Photo, here are some ways you can do so
Text Link
photo Link
<span class="text-link">
<span>
<a target="_blank" href=https://pikwizard.com/photo/analyst-studying-market-downturn-on-laptop-with-red-downward-arrow-and-data-charts/fa1ee6a3c264affd1ea31f0b59f1b6e0/>PikWizard</a>
</span>
</span>
<span class="image-link">
<span
style="margin: 0 0 20px 0; display: inline-block; vertical-align: middle; width: 100%;"
>
<a
target="_blank"
href="https://pikwizard.com/photo/analyst-studying-market-downturn-on-laptop-with-red-downward-arrow-and-data-charts/fa1ee6a3c264affd1ea31f0b59f1b6e0/"
style="text-decoration: none; font-size: 10px; margin: 0;"
>
<img src="https://pikwizard.com/pw/medium/fa1ee6a3c264affd1ea31f0b59f1b6e0.jpg" style="margin: 0; width: 100%;" alt="" />
<p style="font-size: 12px; margin: 0;">PikWizard</p>
</a>
</span>
</span>
Free (free of charge)
Free for personal and commercial use.
Author: People Creations
Similar Free Stock Images

Premium


Premium


Premium


Premium


Premium


Premium


Premium


Premium


Premium


Premium


Premium


Premium


Premium


Premium


Premium


Premium


Premium


Premium


Premium


Premium


Premium


Premium


Premium


Premium