- Home >
- Stock Photos >
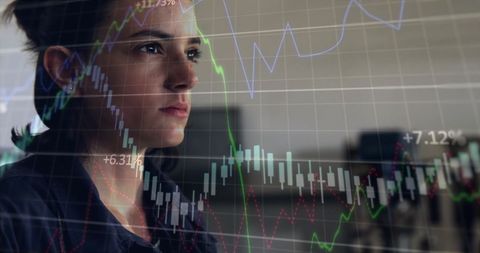
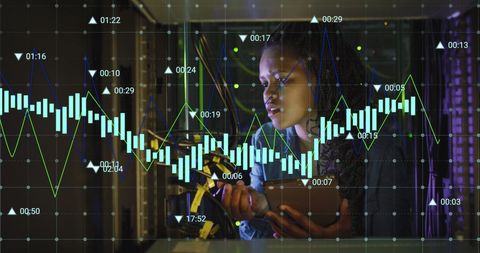
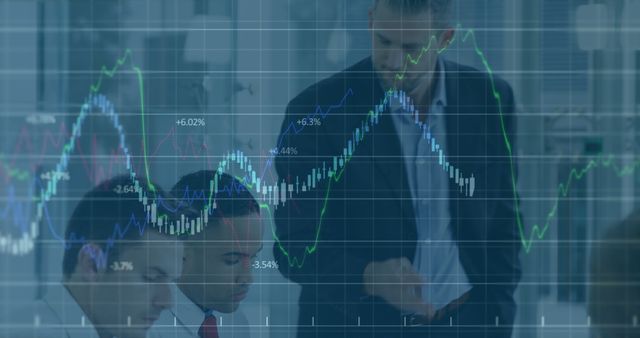
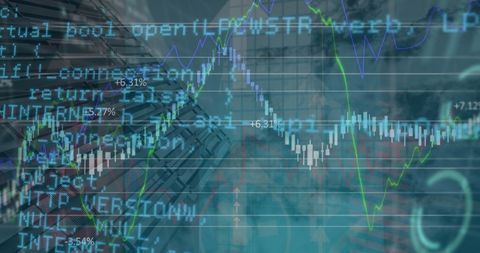
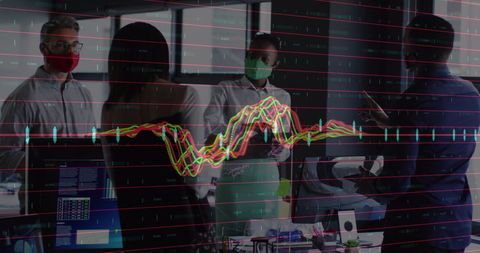
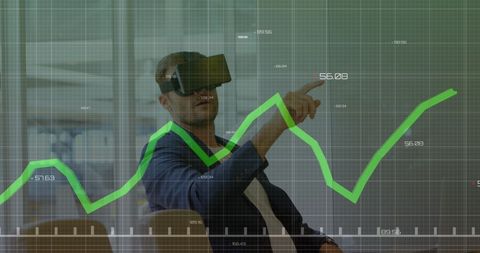
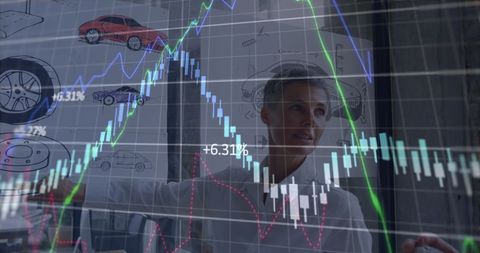
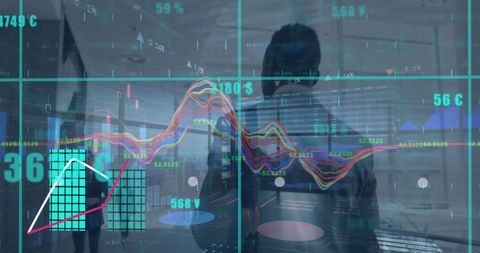
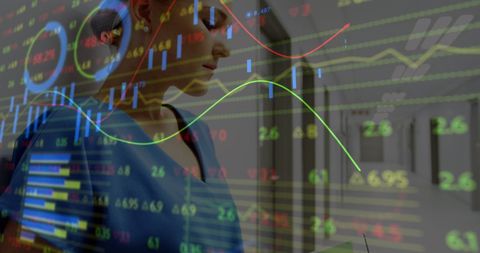
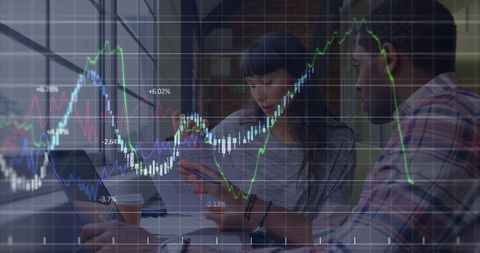
- Analyst Visible within Illuminated Financial Data Graphs and Charts
Analyst Visible within Illuminated Financial Data Graphs and Charts Image
Complex overlays of financial graphs and stock market indicators are featured, integrating human elements with technological symbols. Implies the synthesis of human intellect and modern technology in investment and business analysis. Perfect for illustrating concepts related to forecasting, financial decision-making, or economic education materials.
Powered by  - Get 15% off with code: PIKWIZARD15


downloads
Tags:
More
Credit Photo
If you would like to credit the Photo, here are some ways you can do so
Text Link
photo Link
<span class="text-link">
<span>
<a target="_blank" href=https://pikwizard.com/photo/analyst-visible-within-illuminated-financial-data-graphs-and-charts/ab5904c54cedf76aa1b2f07de4a06ce4/>PikWizard</a>
</span>
</span>
<span class="image-link">
<span
style="margin: 0 0 20px 0; display: inline-block; vertical-align: middle; width: 100%;"
>
<a
target="_blank"
href="https://pikwizard.com/photo/analyst-visible-within-illuminated-financial-data-graphs-and-charts/ab5904c54cedf76aa1b2f07de4a06ce4/"
style="text-decoration: none; font-size: 10px; margin: 0;"
>
<img src="https://pikwizard.com/pw/medium/ab5904c54cedf76aa1b2f07de4a06ce4.jpg" style="margin: 0; width: 100%;" alt="" />
<p style="font-size: 12px; margin: 0;">PikWizard</p>
</a>
</span>
</span>
Free (free of charge)
Free for personal and commercial use.
Author: Creative Art
Similar Free Stock Images
Loading...

Premium


Premium

Premium


Premium


Premium


Premium


Premium

Premium

Premium


Premium

Premium


Premium

Premium


Premium


Premium


Premium


Premium


Premium


Premium

Premium


Premium


Premium


Premium


Premium


Premium