- Home >
- Stock Photos >
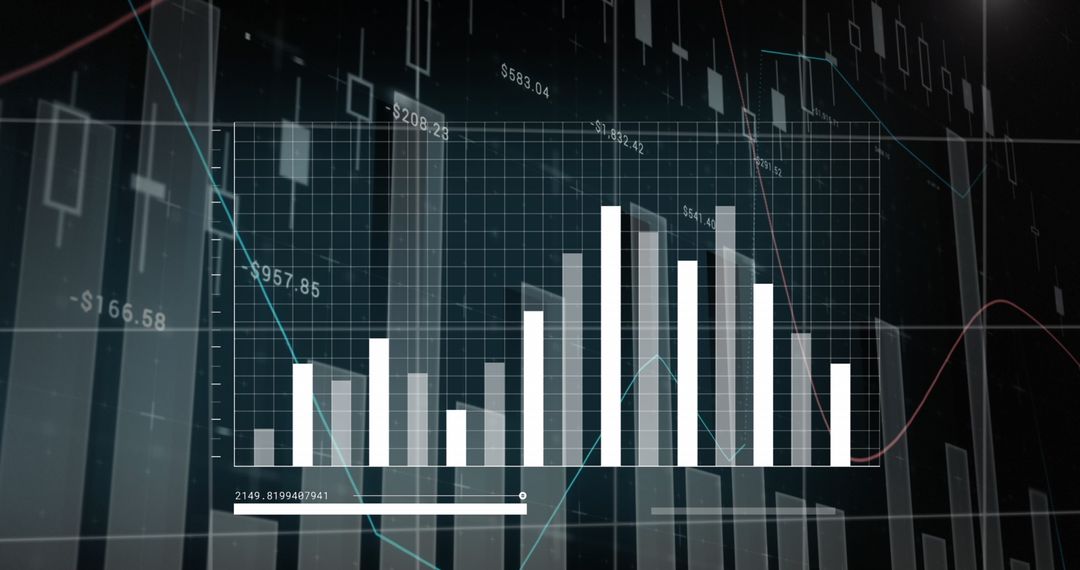
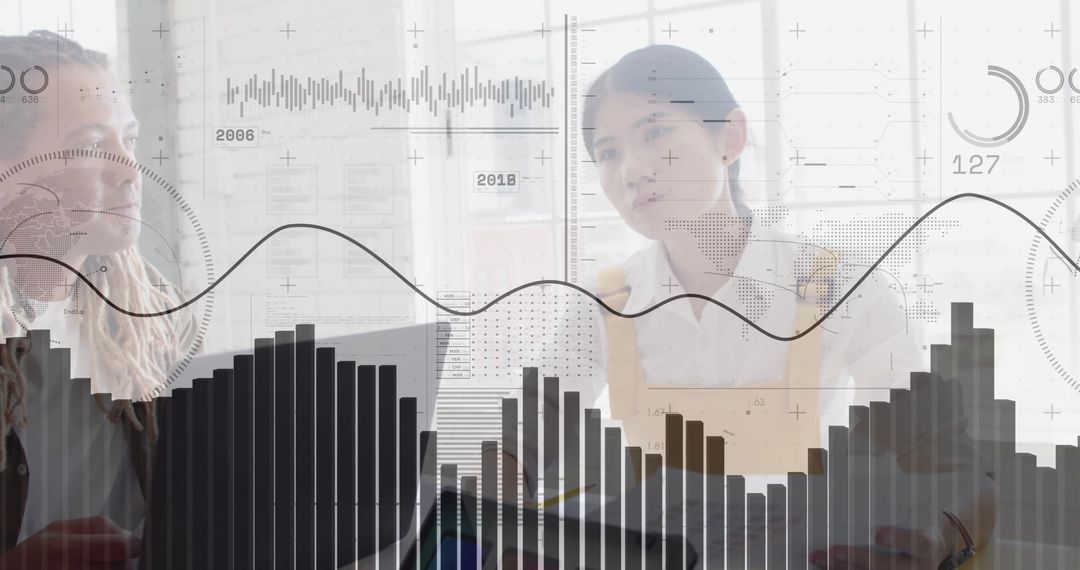
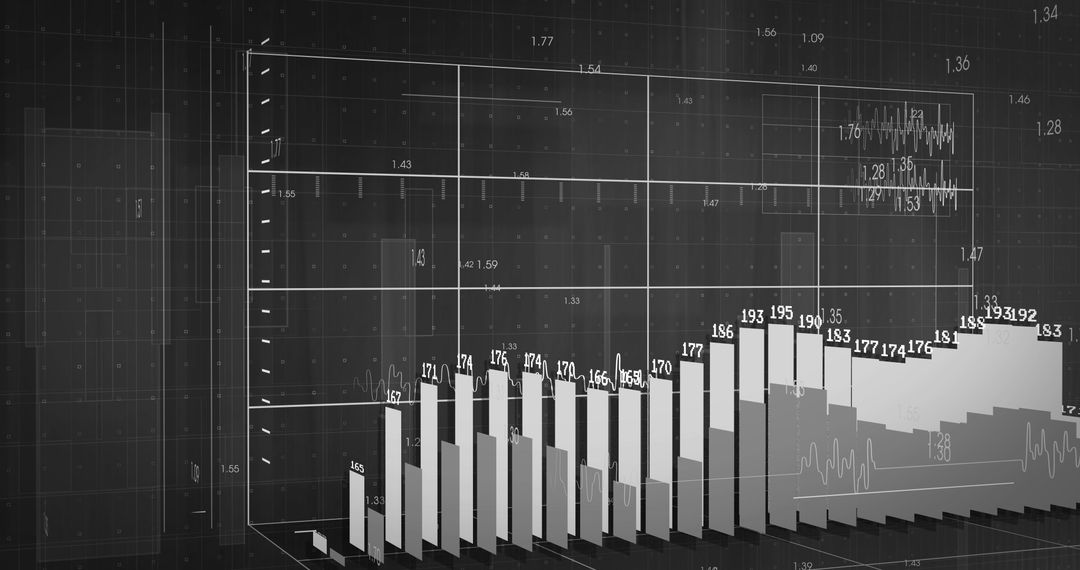
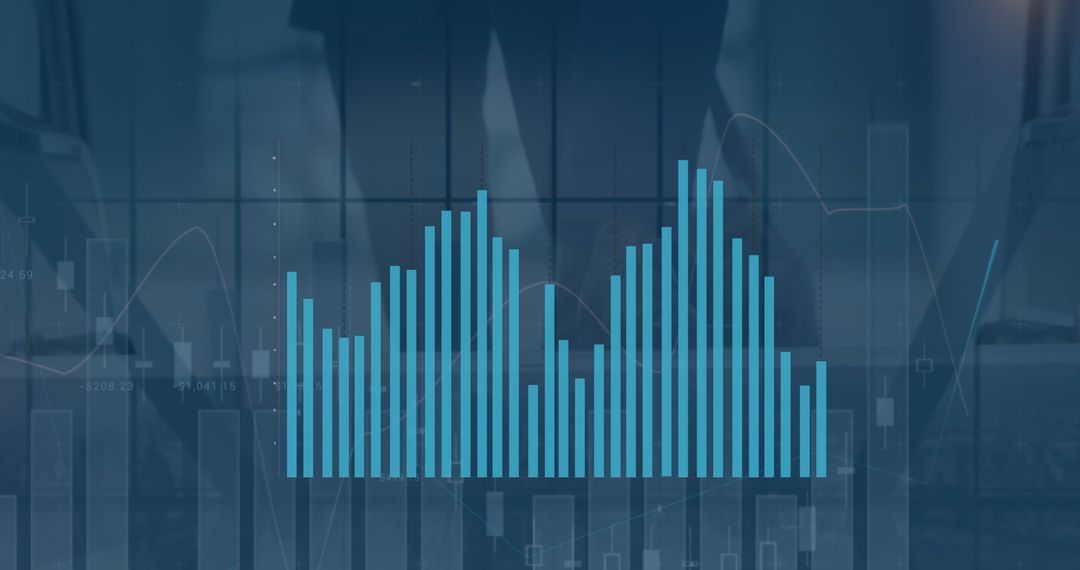
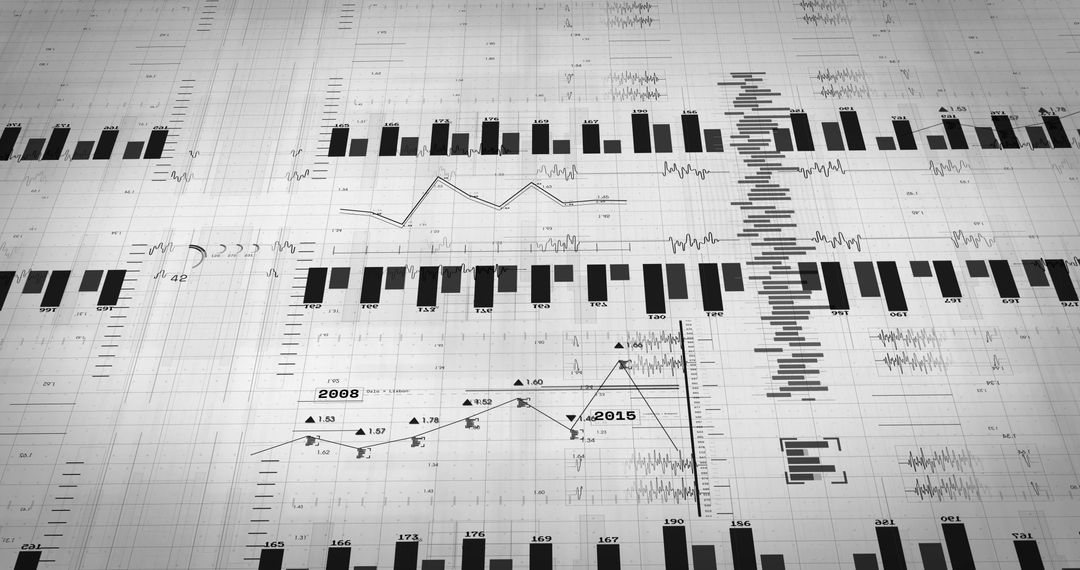
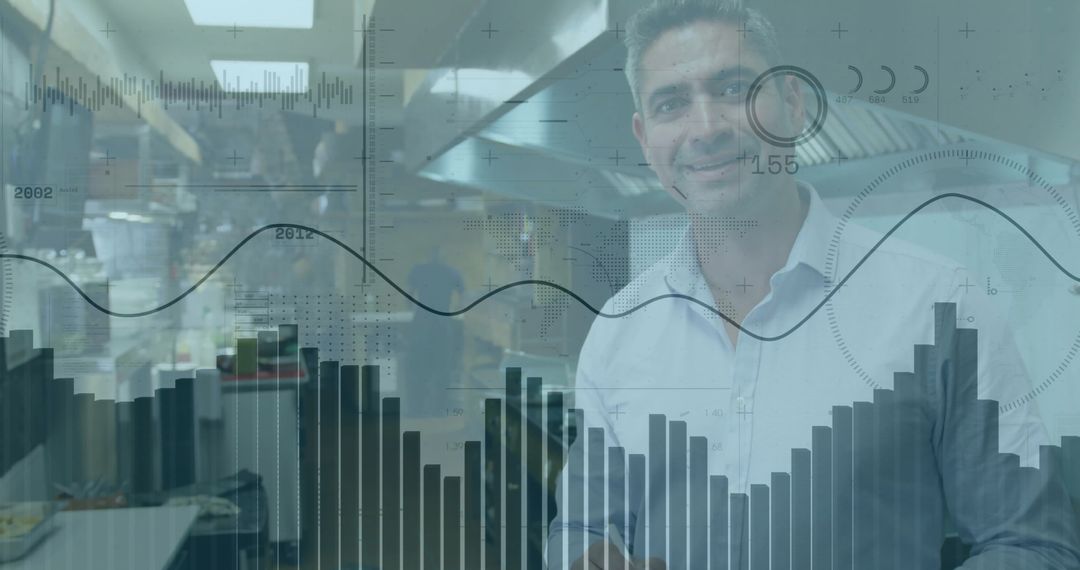
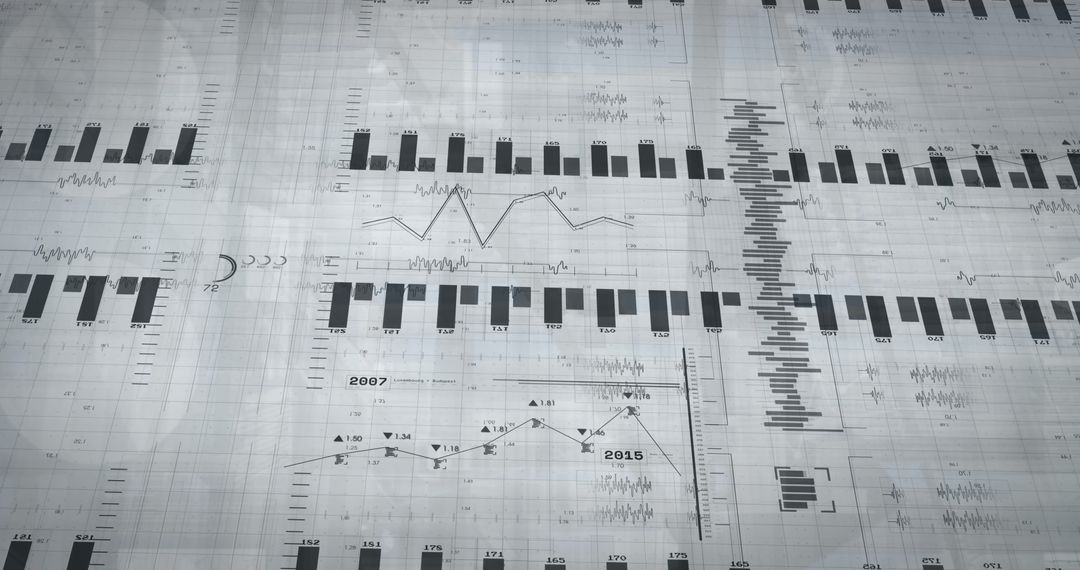
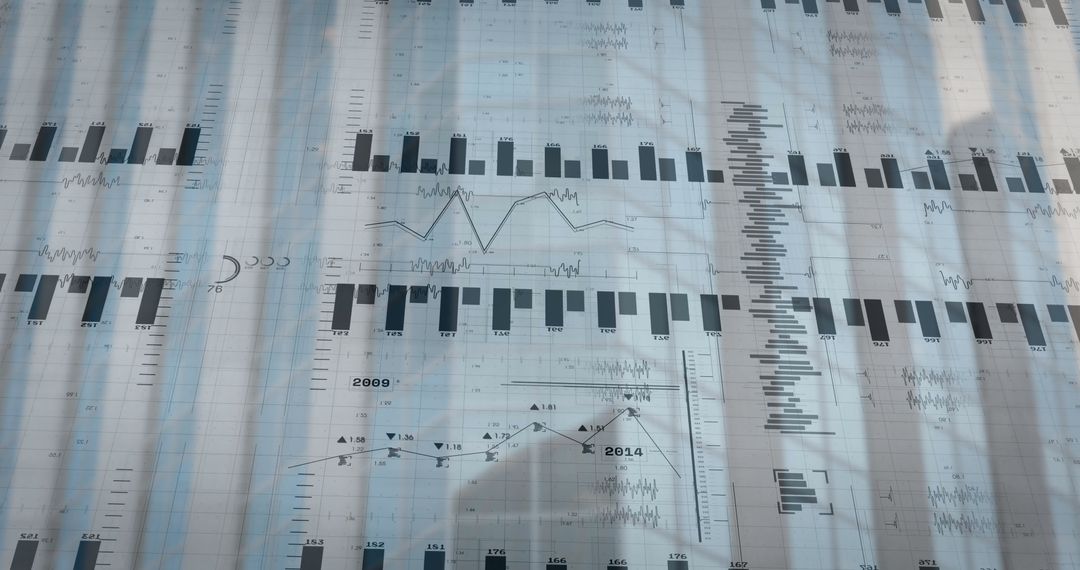
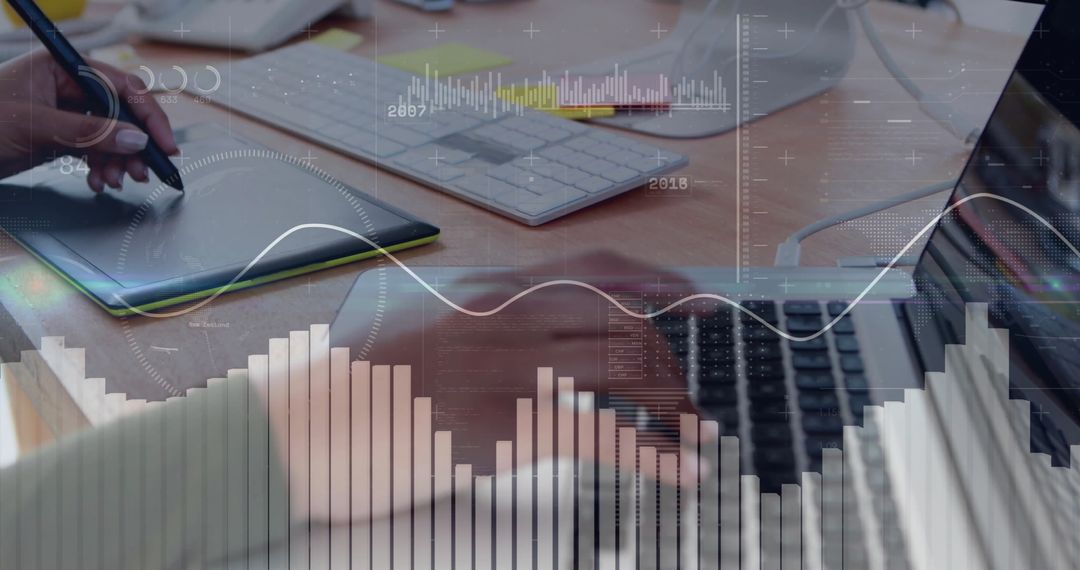
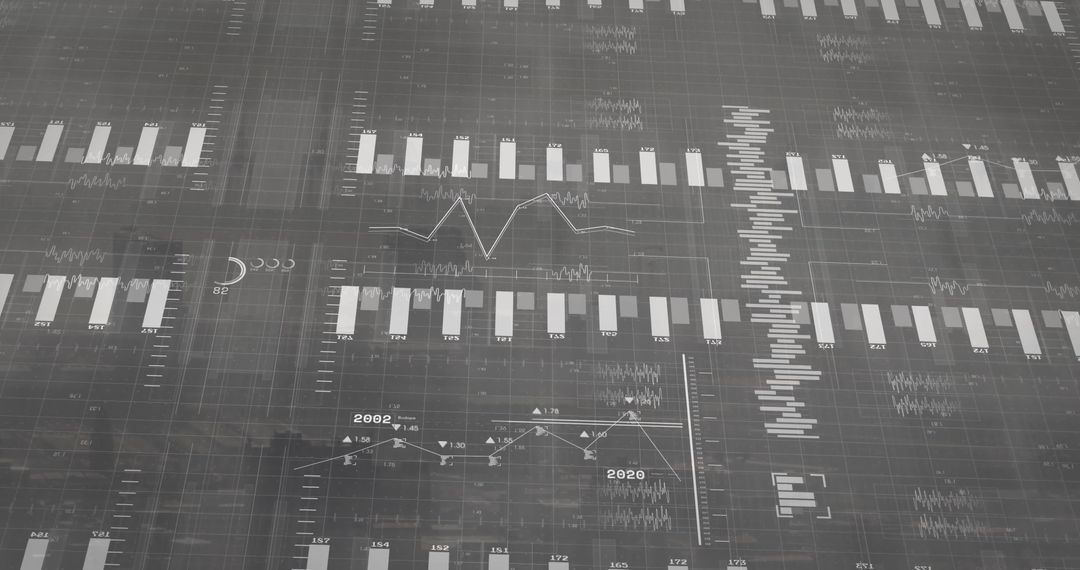
- Analyst Working with Financial Charts and Laptop Overlay Showing Market Data Trends
Analyst Working with Financial Charts and Laptop Overlay Showing Market Data Trends Image
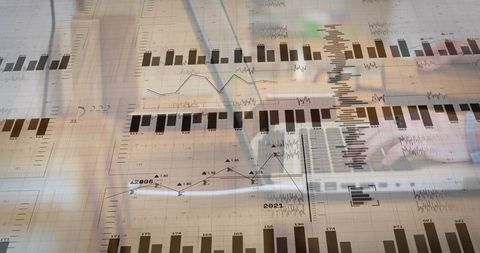
Showing hands writing on paper while typing on laptop with layered financial charts and bar graphs overlay. Featuring line charts, bar diagrams, and timeline markers that emphasize market movement and data trends. Conveying analytical workflow, report preparation, and investment research in modern office workspace. Ideal for illustrating articles, blog posts, presentations about finance, investing, market analysis, business intelligence, and data-driven strategy. Fitting as website hero, report cover, slide background, social media post, or advertising creative for fintech, accounting, consulting. High-resolution composition allowing text overlay and cropping for banners and hero graphics.
Powered by  - Get 15% off with code: PIKWIZARD15


0
downloads
downloads
Tags:
More
Credit Photo
If you would like to credit the Photo, here are some ways you can do so
Text Link
photo Link
<span class="text-link">
<span>
<a target="_blank" href=https://pikwizard.com/photo/analyst-working-with-financial-charts-and-laptop-overlay-showing-market-data-trends/96aa9f1105704c545495333675b9c33d/>PikWizard</a>
</span>
</span>
<span class="image-link">
<span
style="margin: 0 0 20px 0; display: inline-block; vertical-align: middle; width: 100%;"
>
<a
target="_blank"
href="https://pikwizard.com/photo/analyst-working-with-financial-charts-and-laptop-overlay-showing-market-data-trends/96aa9f1105704c545495333675b9c33d/"
style="text-decoration: none; font-size: 10px; margin: 0;"
>
<img src="https://pikwizard.com/pw/medium/96aa9f1105704c545495333675b9c33d.jpg" style="margin: 0; width: 100%;" alt="" />
<p style="font-size: 12px; margin: 0;">PikWizard</p>
</a>
</span>
</span>
Free (free of charge)
Free for personal and commercial use.
Author: People Creations
Similar Free Stock Images

Premium


Premium


Premium


Premium


Premium


Premium


Premium


Premium


Premium


Premium


Premium


Premium


Premium


Premium


Premium


Premium


Premium


Premium


Premium


Premium

Premium


Premium


Premium


Premium