- Home >
- Stock Photos >
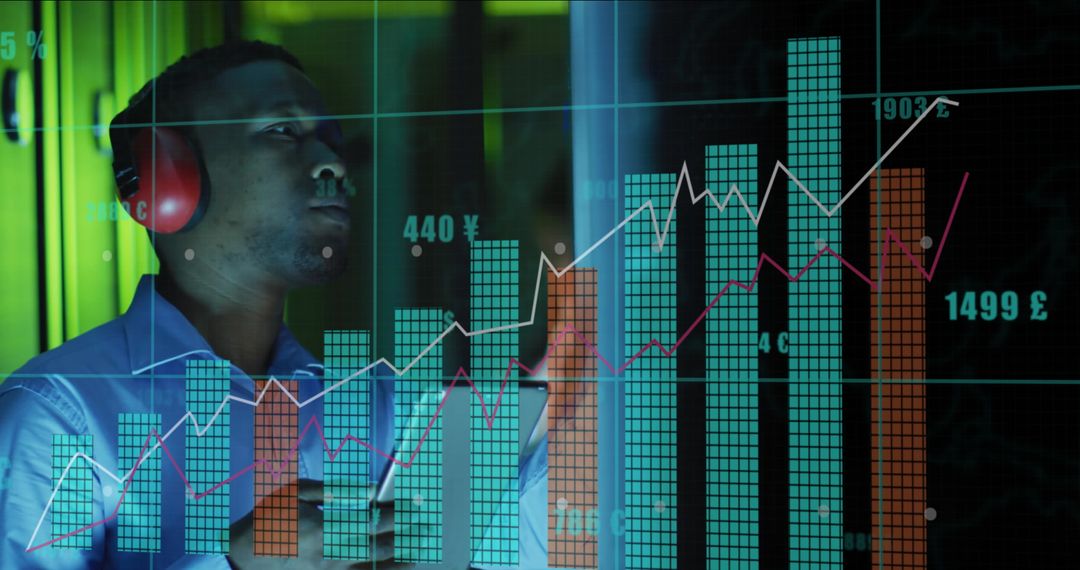
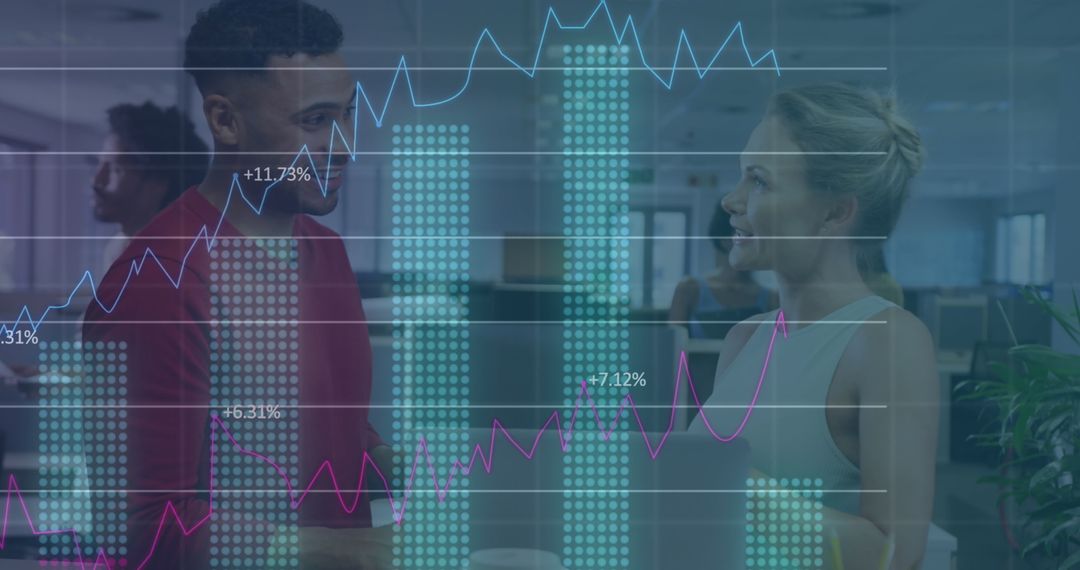
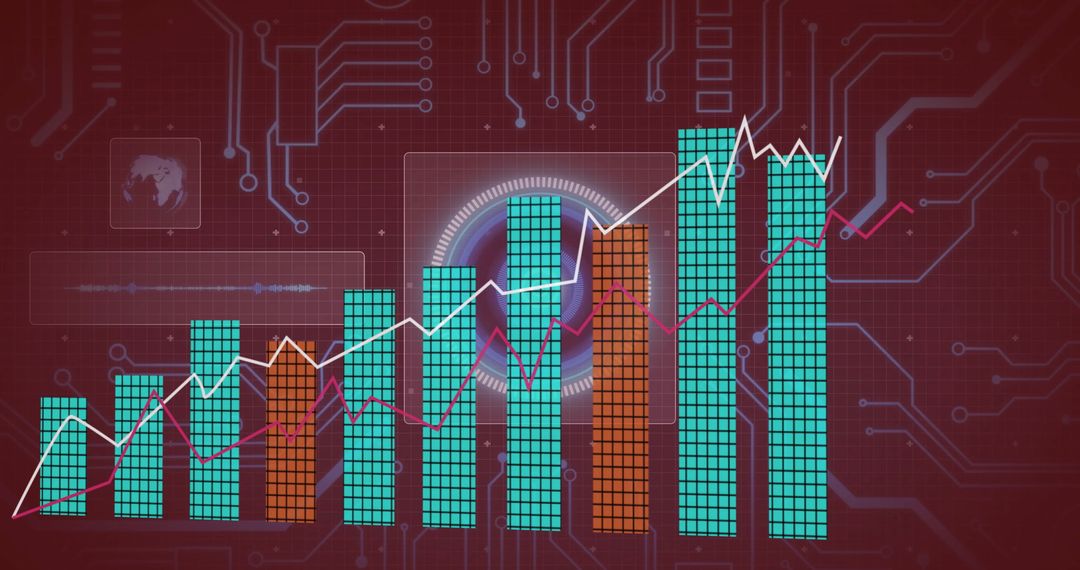
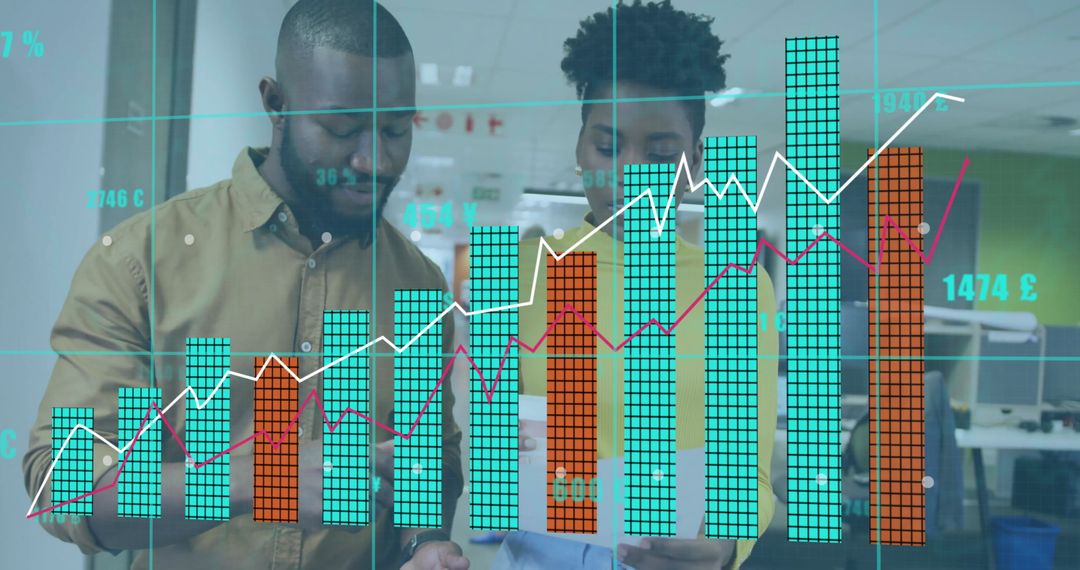
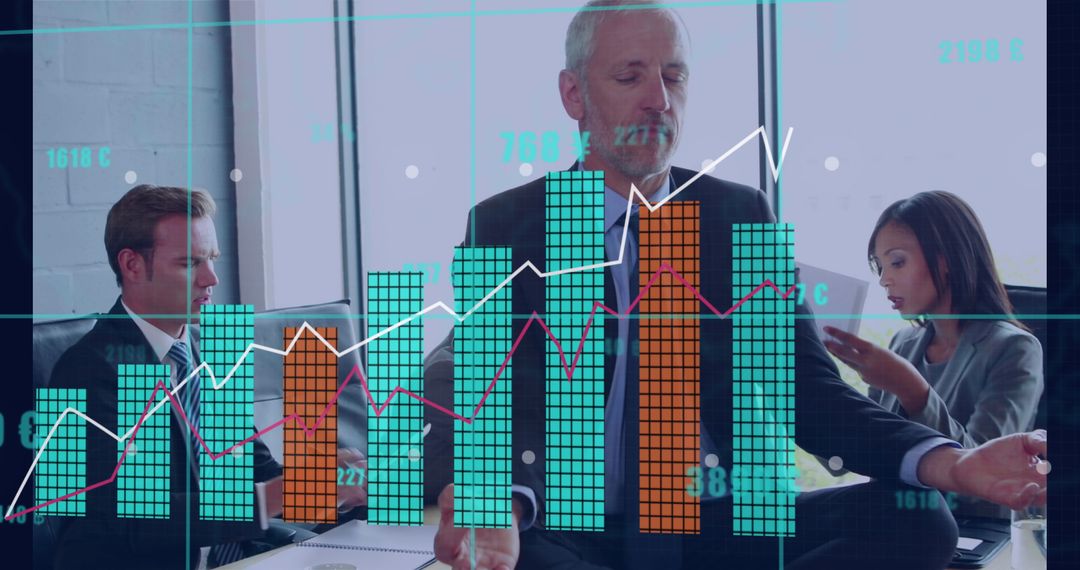
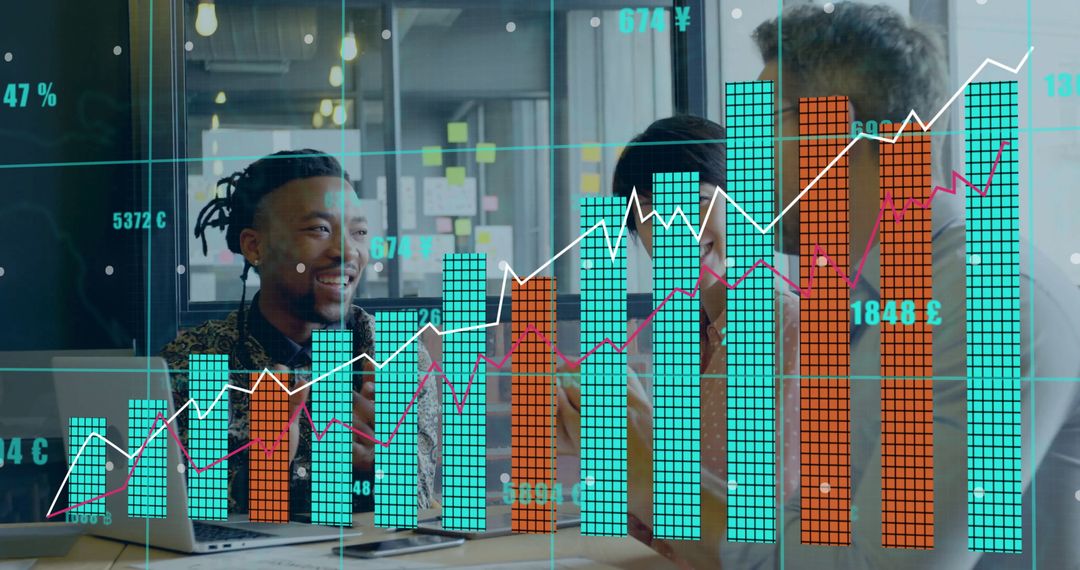
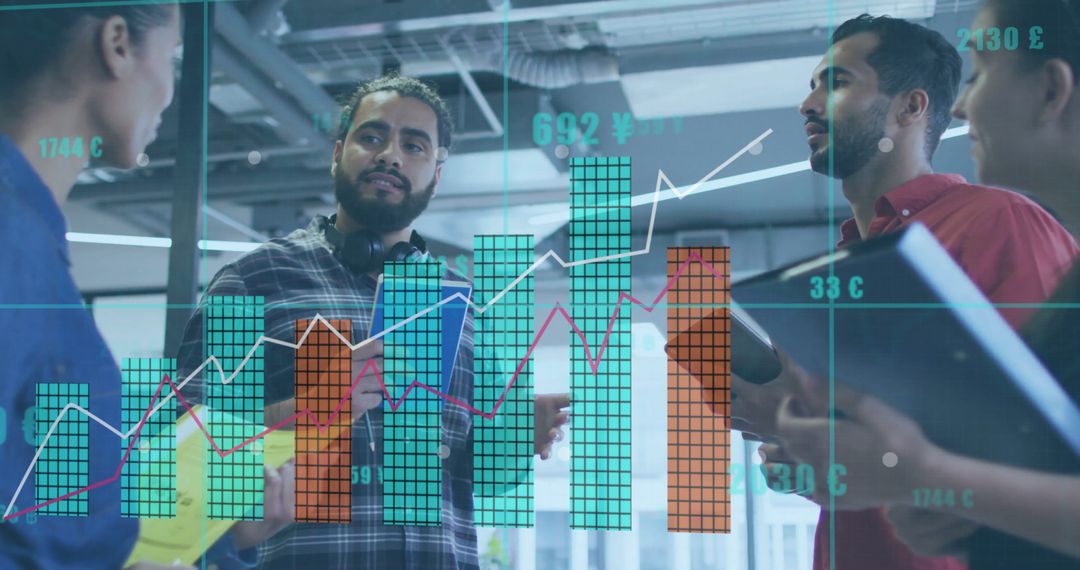
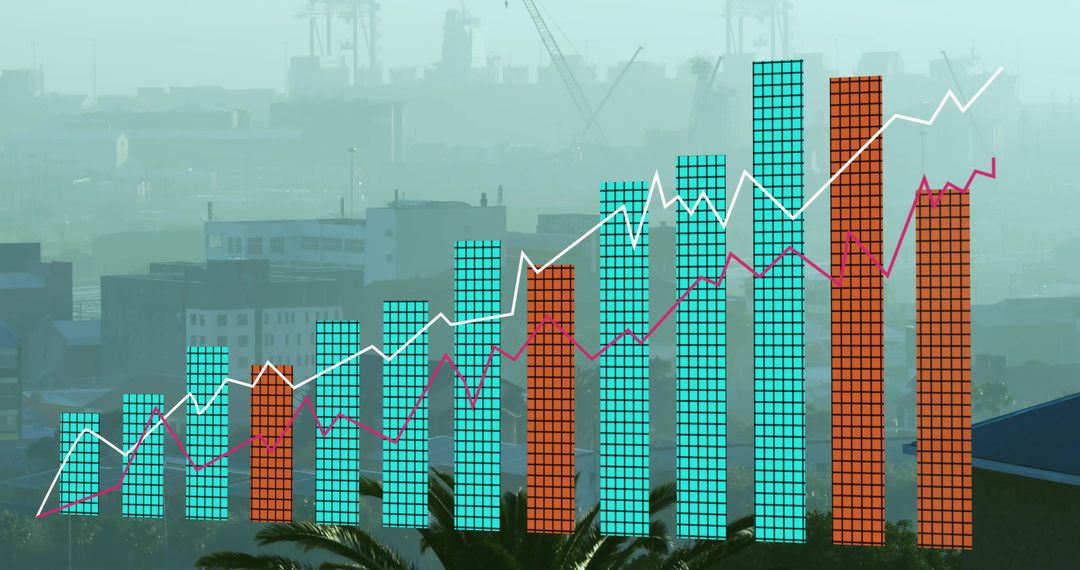
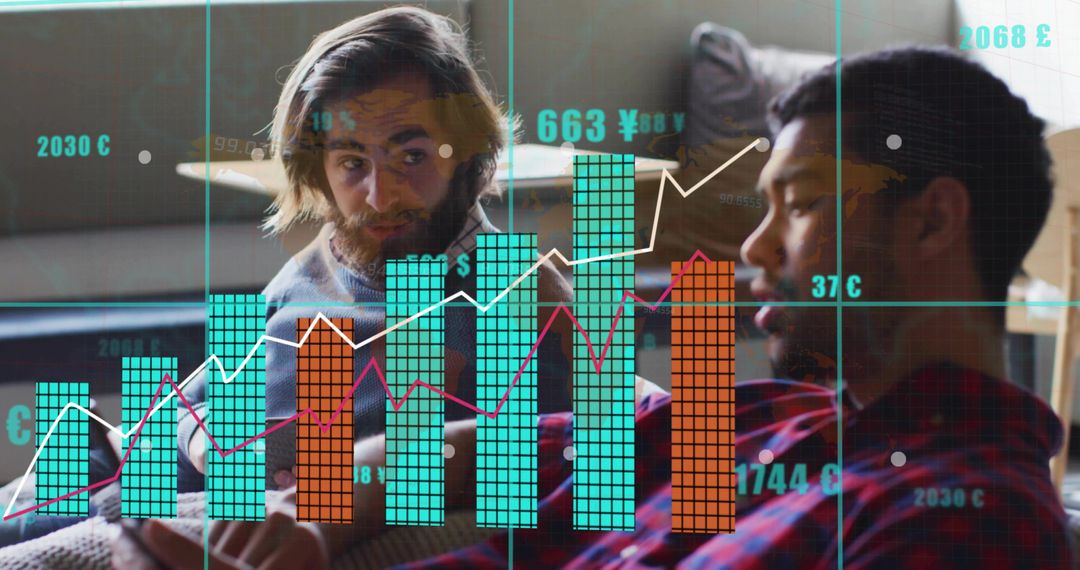
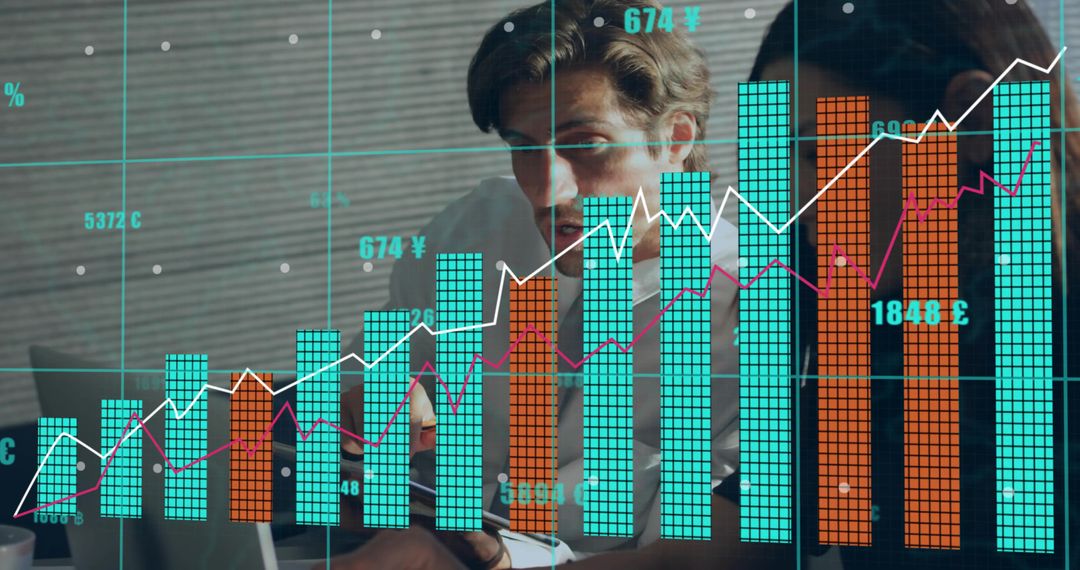
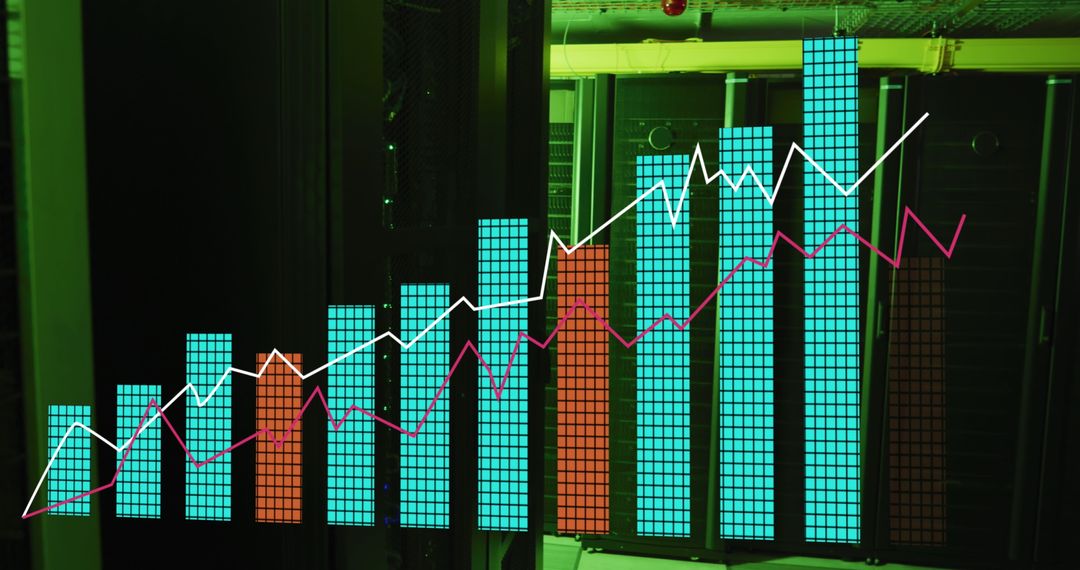
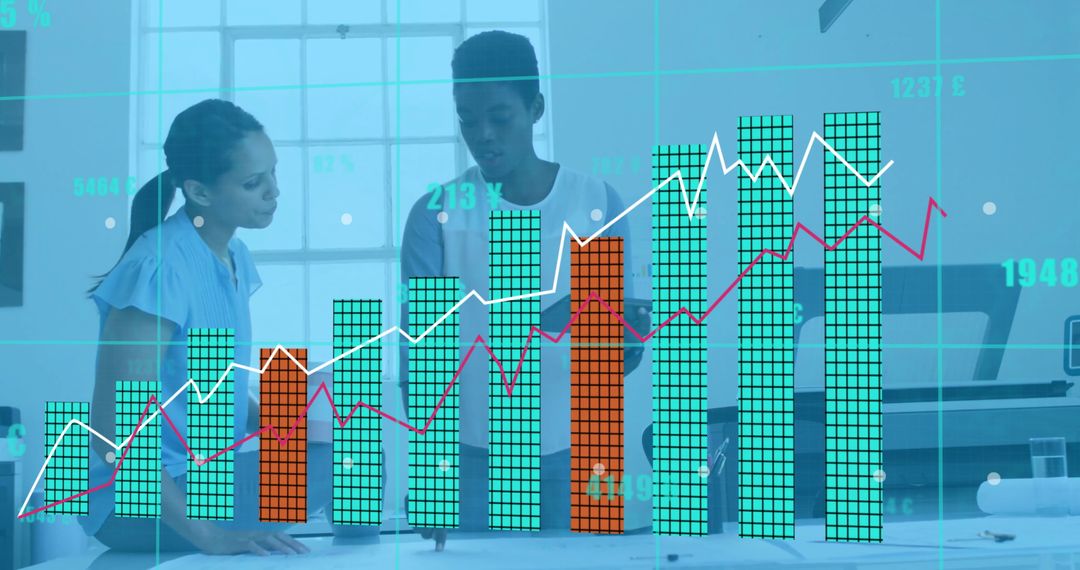
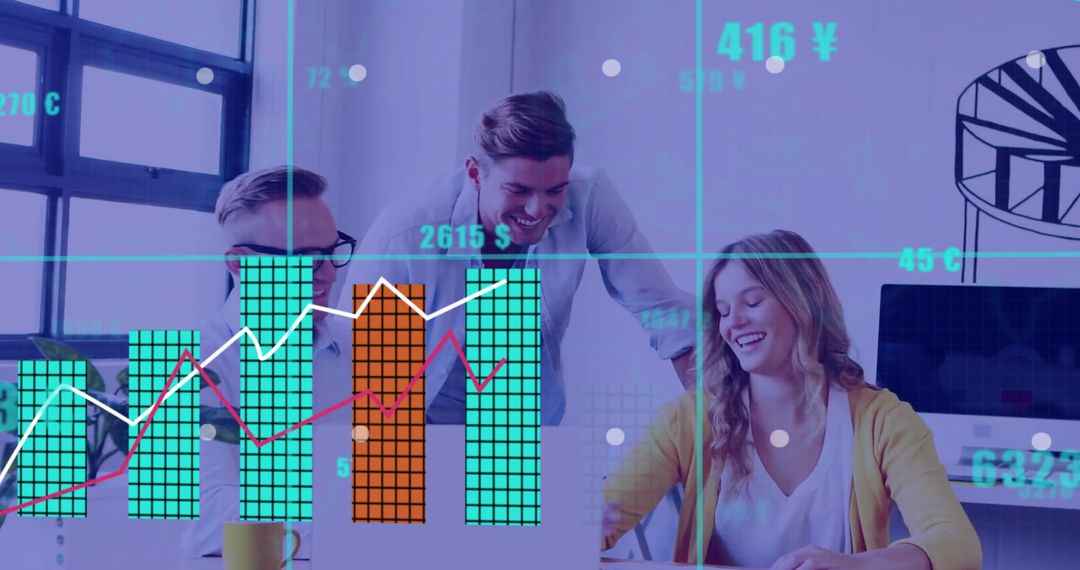
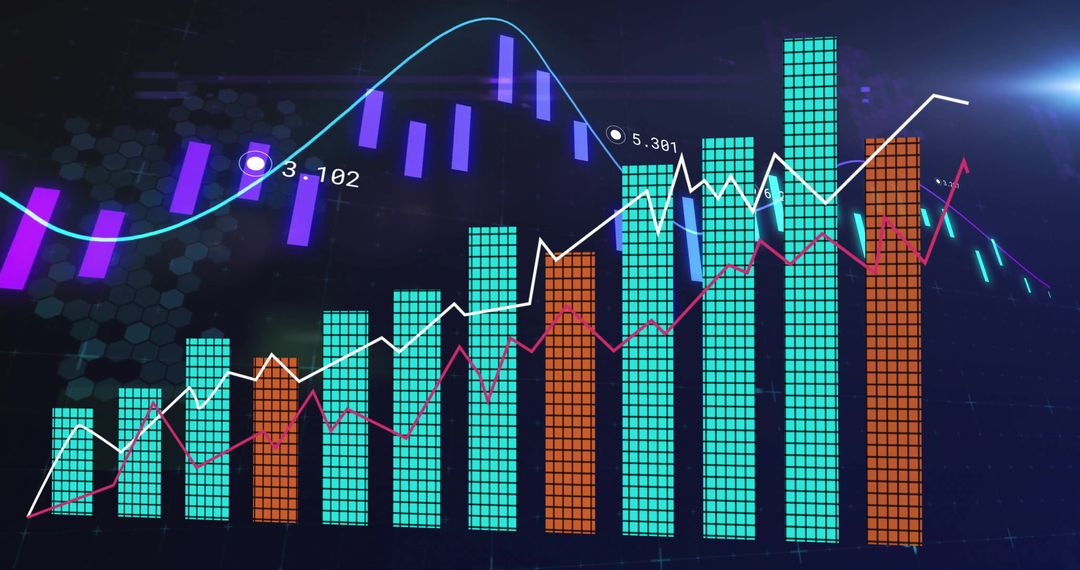
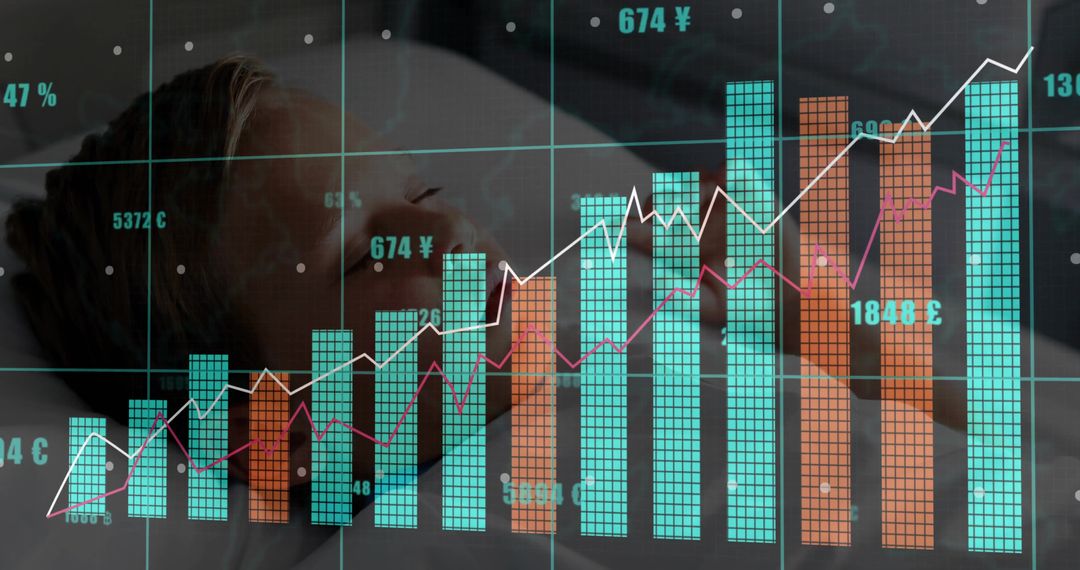
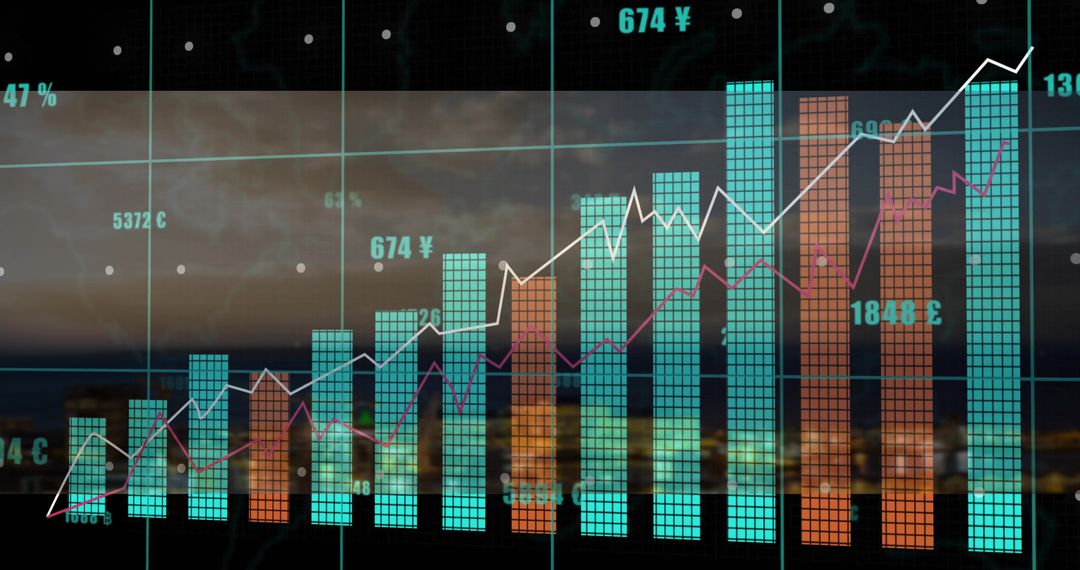
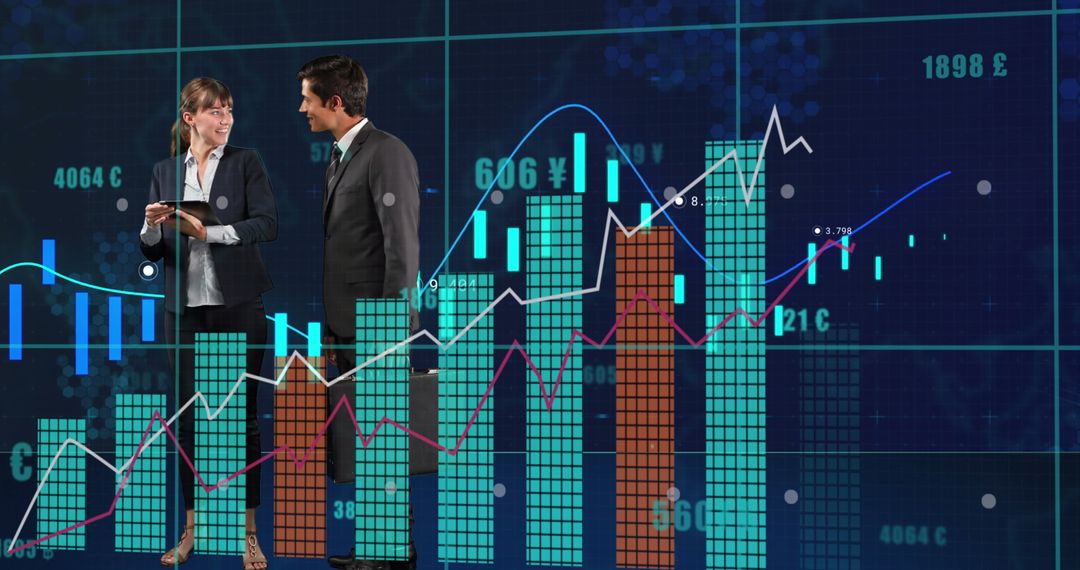
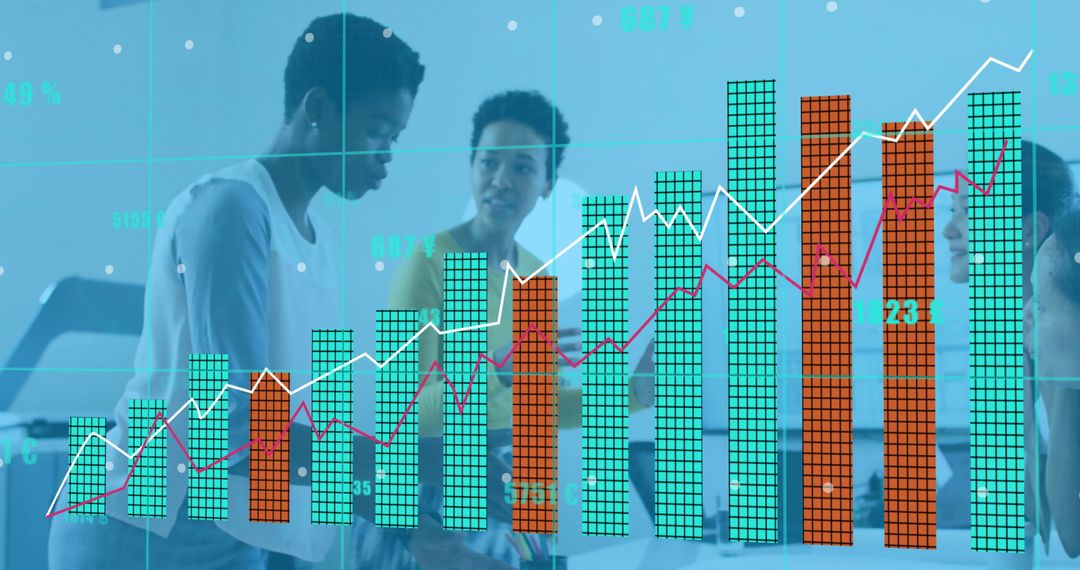
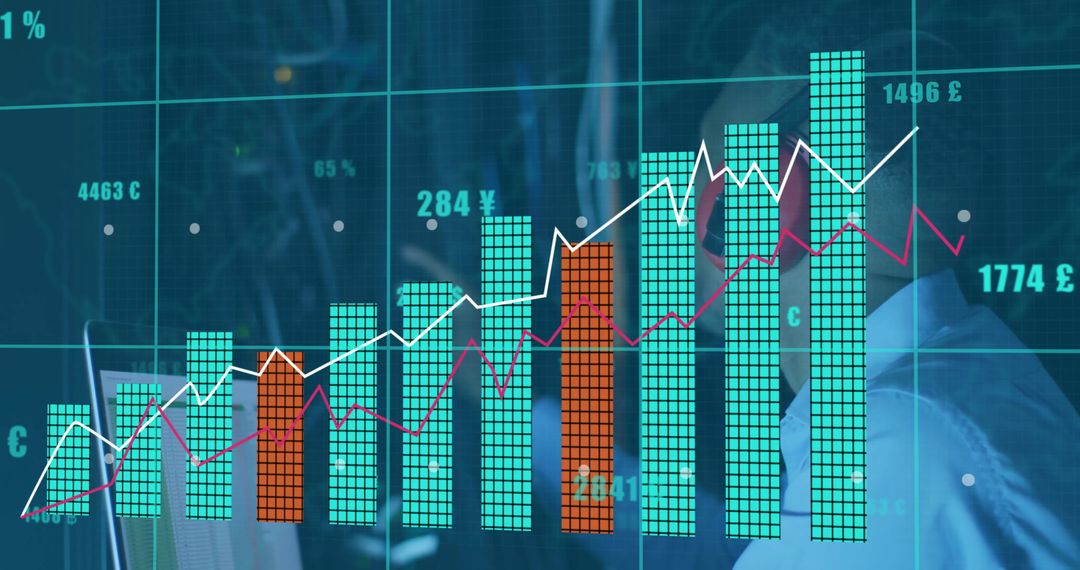
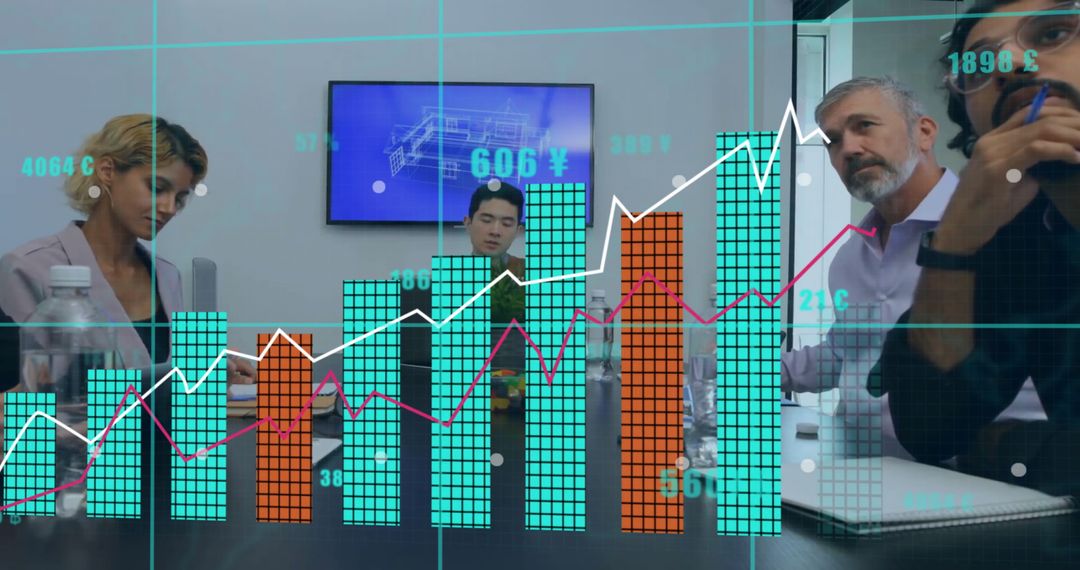
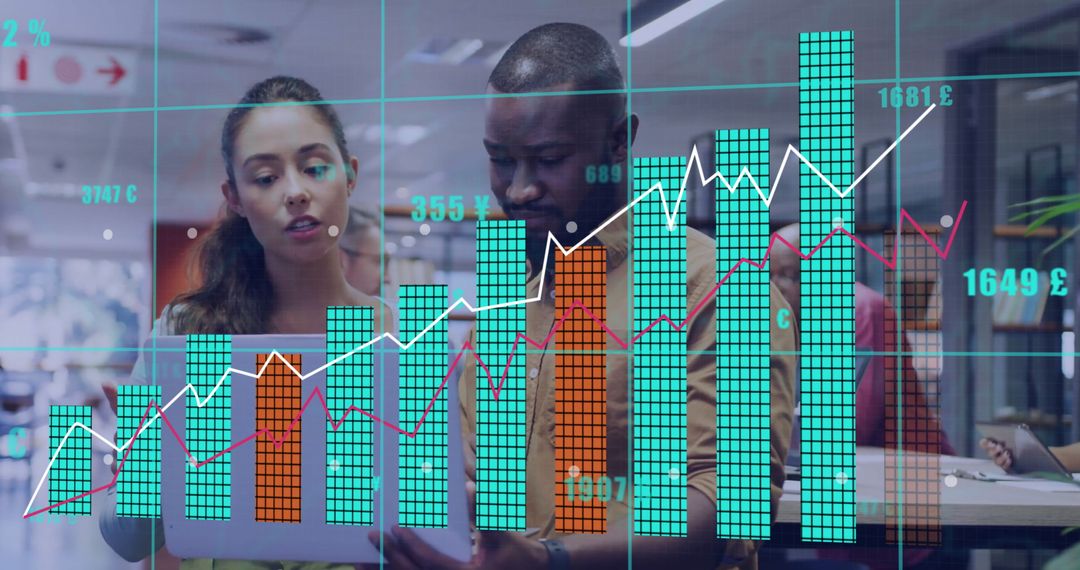
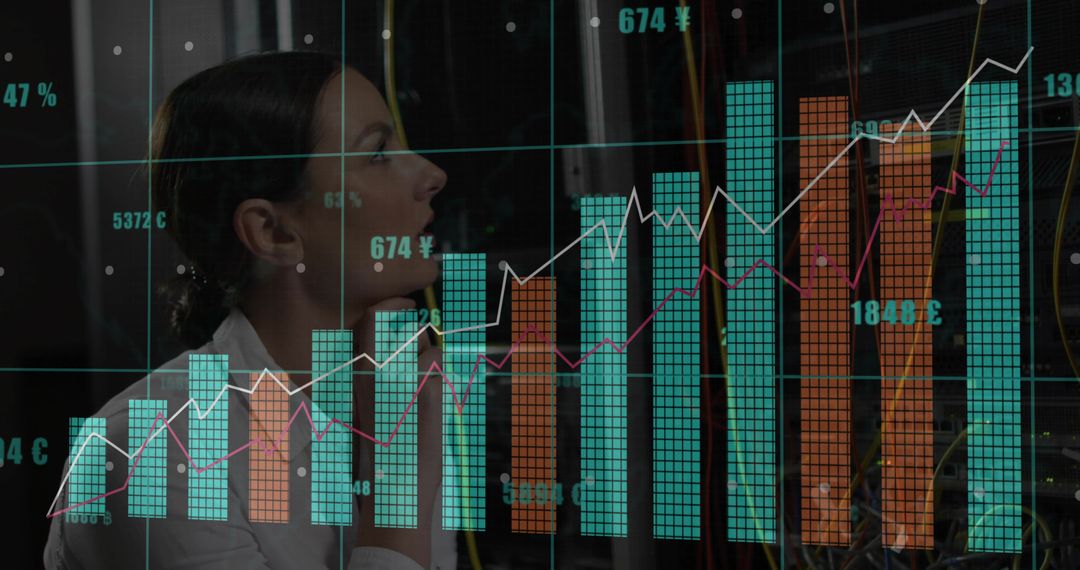
- Analysts analyzing financial dashboard with turquoise orange bar charts and line trends
Analysts analyzing financial dashboard with turquoise orange bar charts and line trends Image
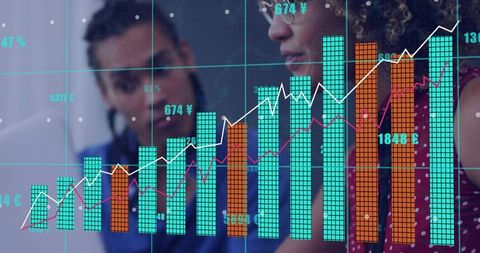
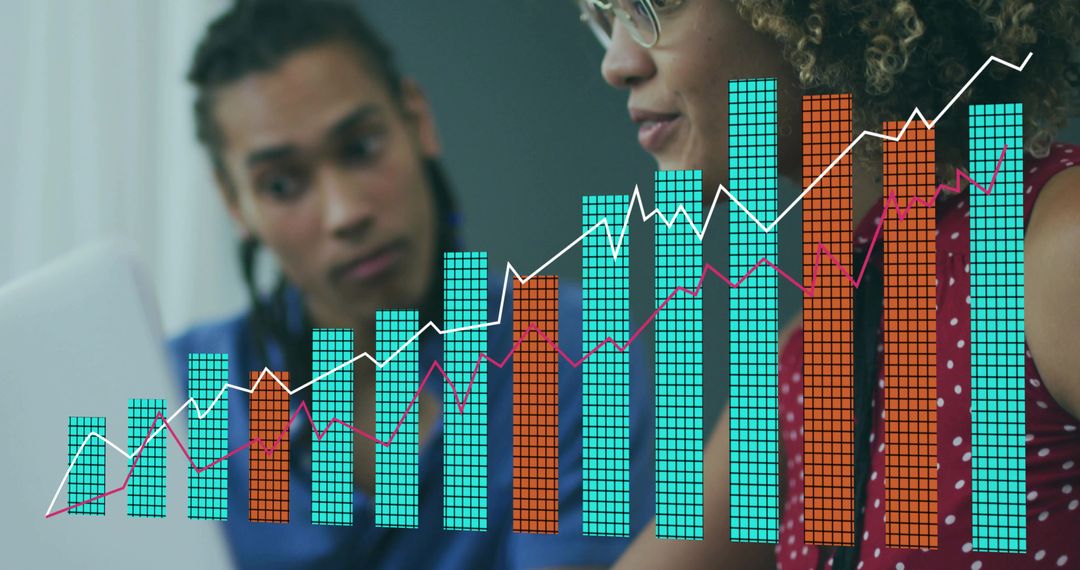
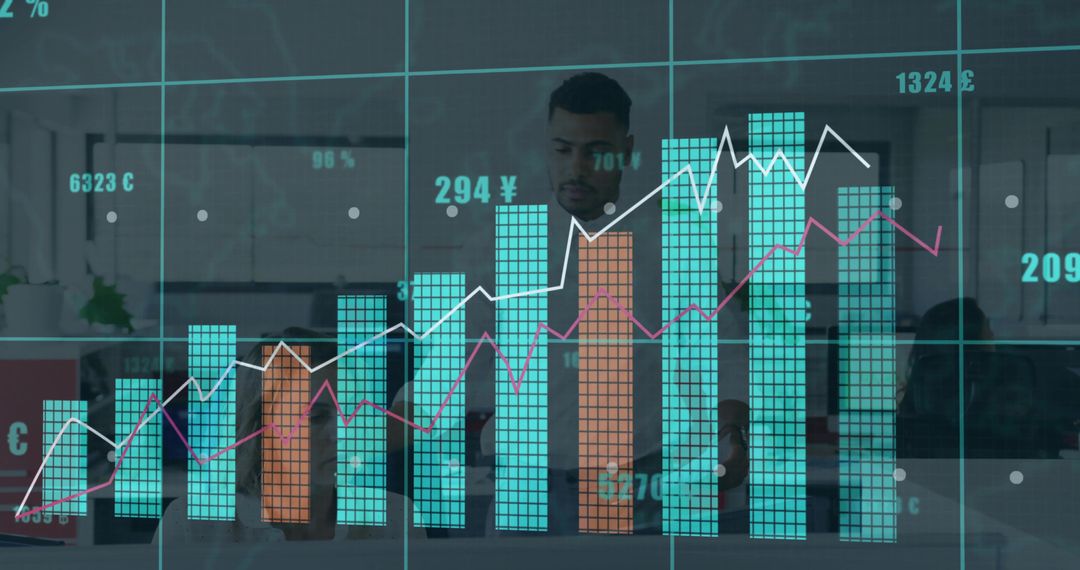
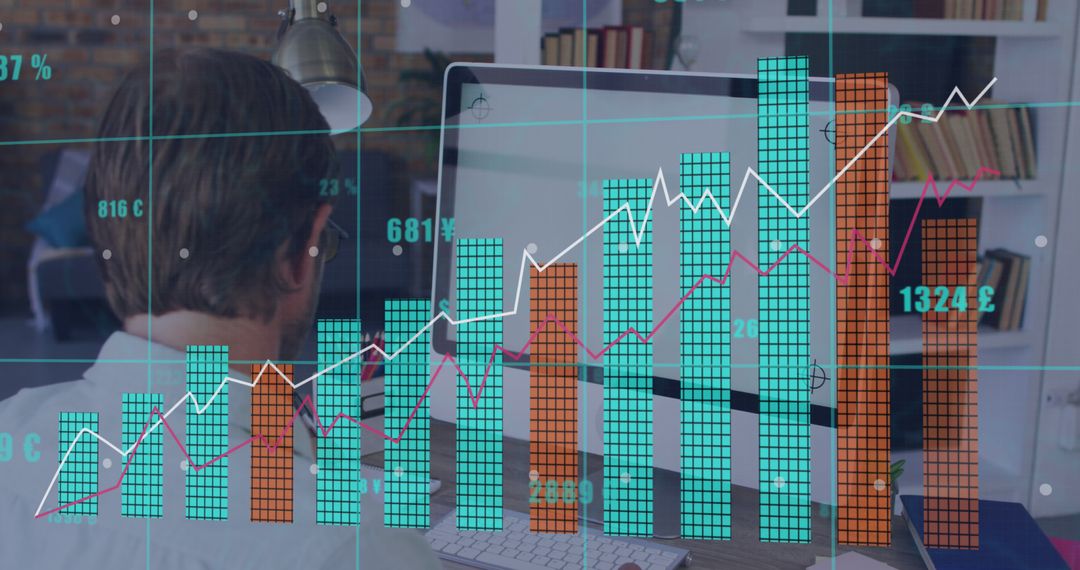
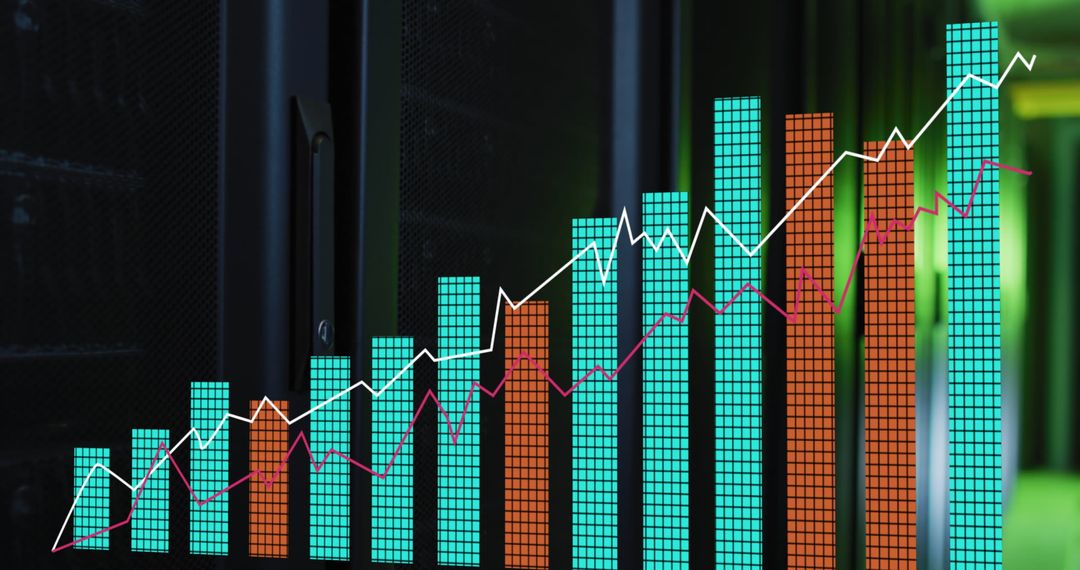
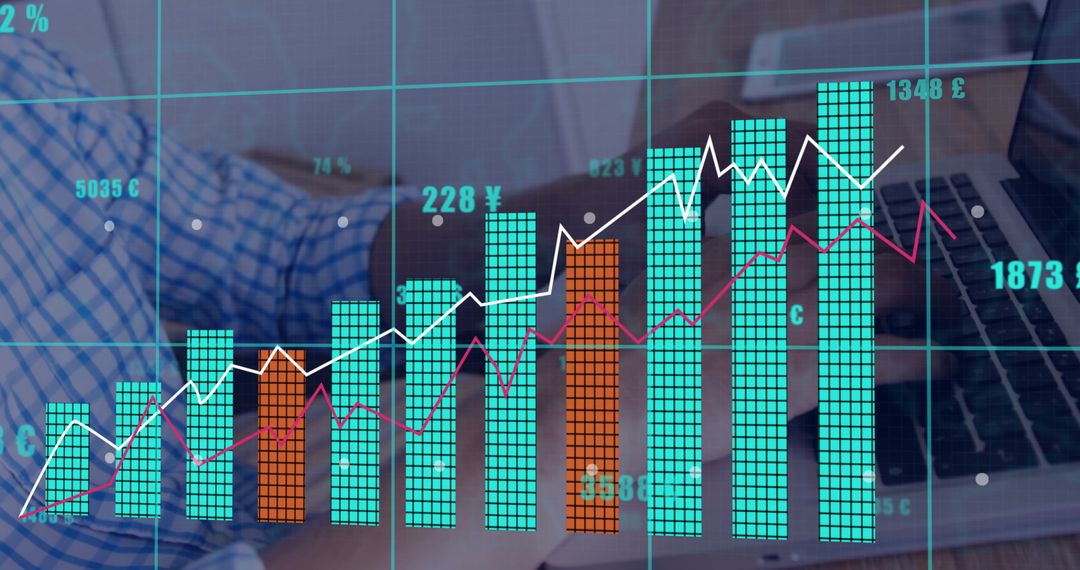
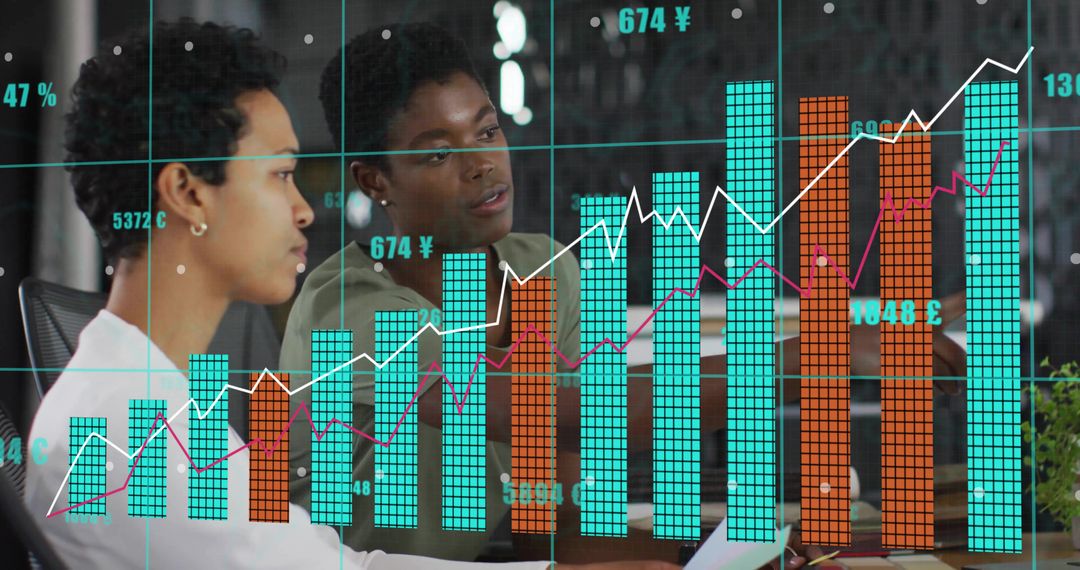
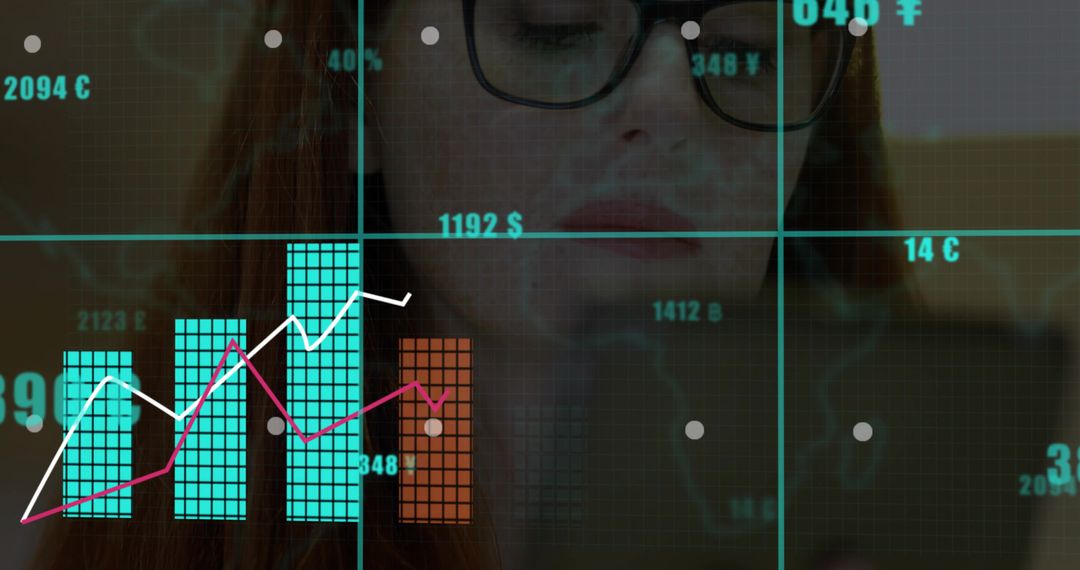
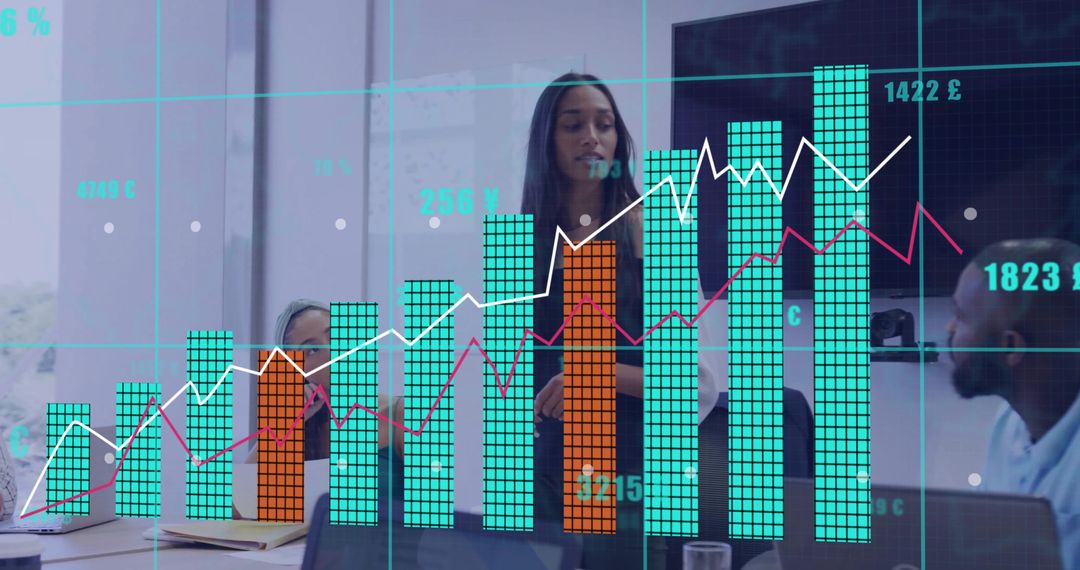
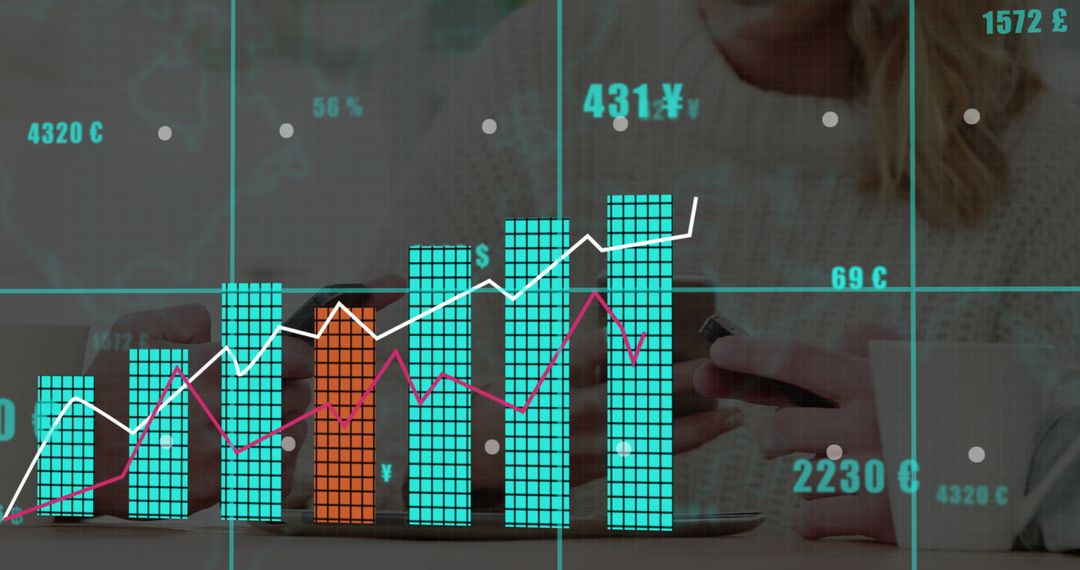
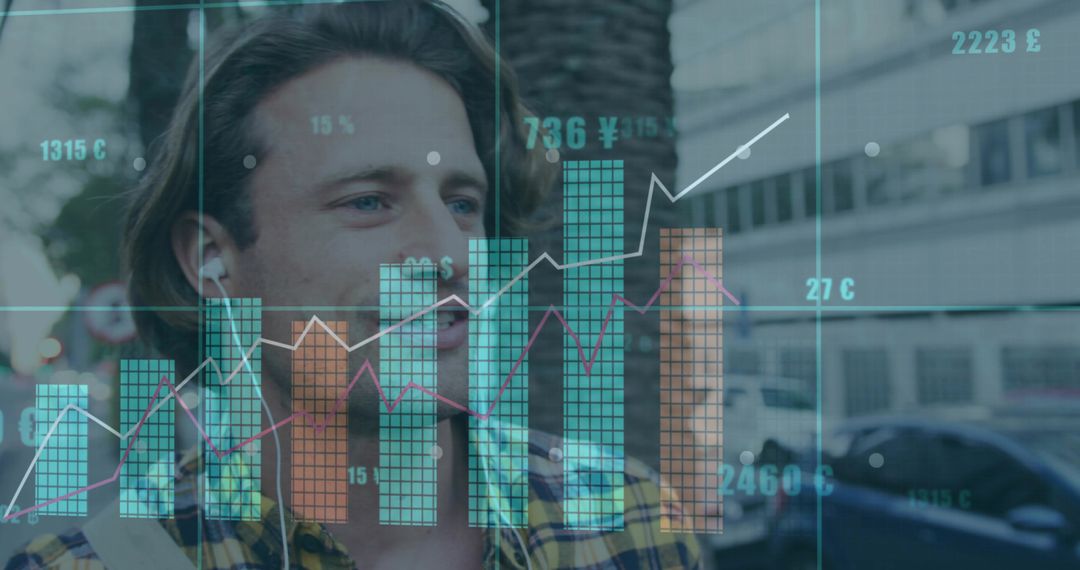
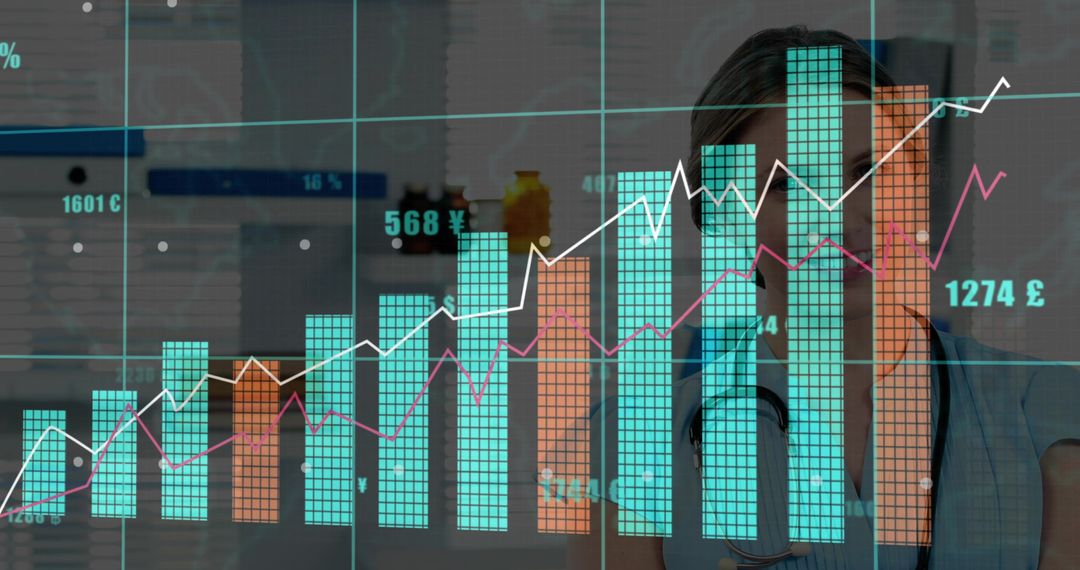
Two professionals analyzing interactive financial dashboard overlaid with turquoise and orange bar charts, white and magenta line graphs, currency labels (¥, £, €). Background figures softly blurring to create depth while data visualization remaining crisp and prominent. Featuring high-contrast turquoise and orange palette, suitable for modern finance branding and fintech interfaces. Offering ample left-frame negative space for headline, statistic callout, or call-to-action overlay. Ideal for business presentations, website hero banners, annual reports, investor decks, fintech product pages, market analysis articles, corporate training materials, and social media campaigns. Use for highlighting market growth, demonstrating performance metrics, illustrating data-driven strategy, or supporting editorial about finance and analytics.
Powered by 


0
downloads
downloads
Tags:
More
Credit Photo
If you would like to credit the Photo, here are some ways you can do so
Text Link
photo Link
<span class="text-link">
<span>
<a target="_blank" href=https://pikwizard.com/photo/analysts-analyzing-financial-dashboard-with-turquoise-orange-bar-charts-and-line-trends/10d28a13082338963926a4231834be37/>PikWizard</a>
</span>
</span>
<span class="image-link">
<span
style="margin: 0 0 20px 0; display: inline-block; vertical-align: middle; width: 100%;"
>
<a
target="_blank"
href="https://pikwizard.com/photo/analysts-analyzing-financial-dashboard-with-turquoise-orange-bar-charts-and-line-trends/10d28a13082338963926a4231834be37/"
style="text-decoration: none; font-size: 10px; margin: 0;"
>
<img src="https://pikwizard.com/pw/medium/10d28a13082338963926a4231834be37.jpg" style="margin: 0; width: 100%;" alt="" />
<p style="font-size: 12px; margin: 0;">PikWizard</p>
</a>
</span>
</span>
Free (free of charge)
Free for personal and commercial use.
Author: Creative Art
Similar Free Stock Images

Premium


Premium


Premium


Premium


Premium


Premium


Premium


Premium


Premium


Premium


Premium


Premium
Premium


Premium


Premium


Premium


Premium


Premium


Premium


Premium


Premium


Premium


Premium


Premium