
- Home >
- Stock Photos >
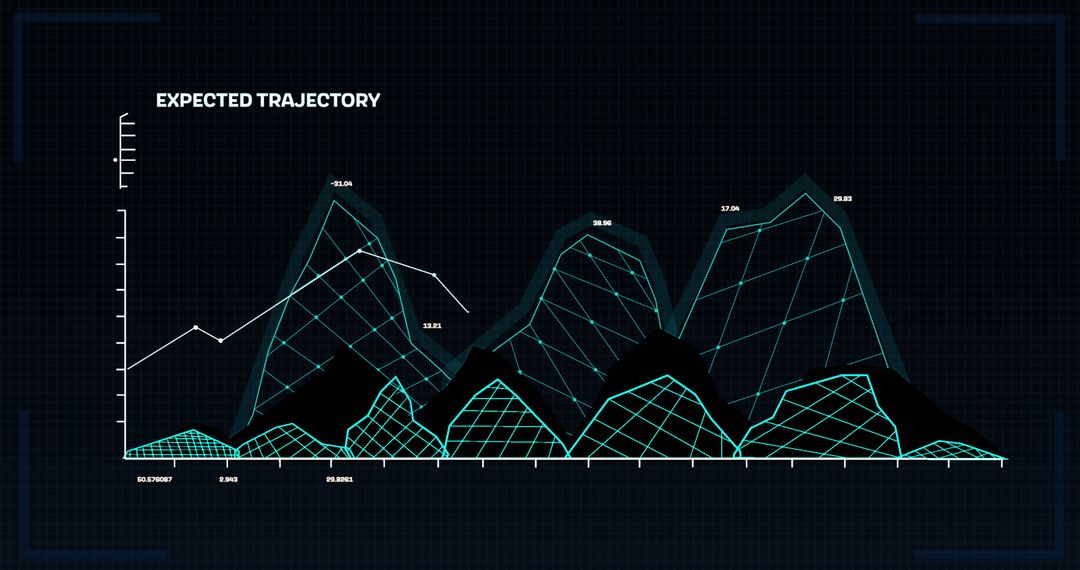
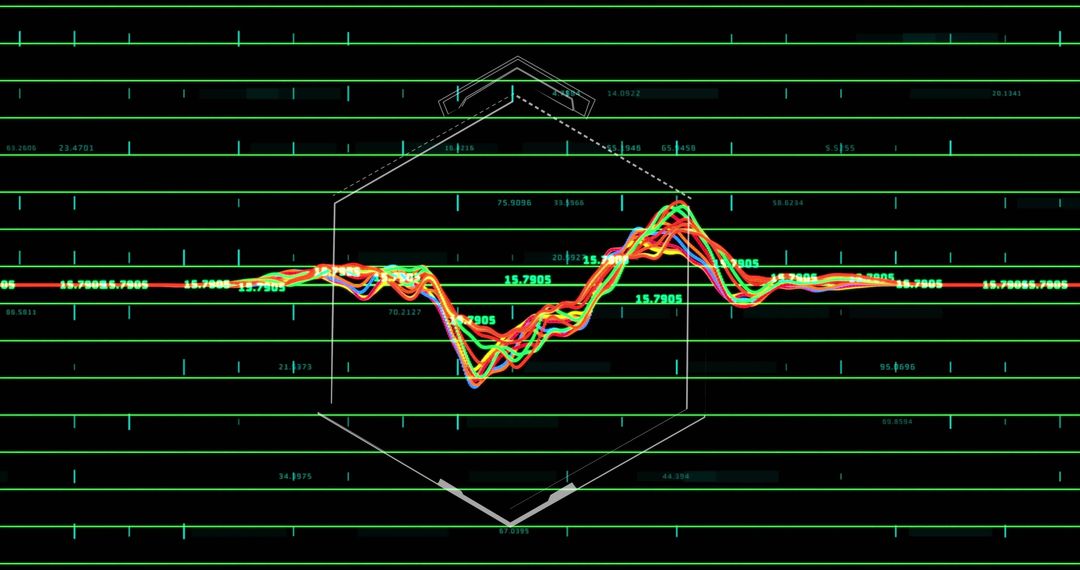
- Analytical Charts with Data Lines Display on Digital Screen
Analytical Charts with Data Lines Display on Digital Screen Image

Visually striking chart with cyan bars, red lines, and white dashed overlays. Ideal for presentations on statistical analysis, business reports, or technology projects. Perfect for illustrating analytics software capabilities or modern business intelligence tools, and effective in infographics highlighting growth trends and digital data analysis.
Powered by  - Get 15% off with code: PIKWIZARD15


0
downloads
downloads
Tags:
More
Credit Photo
If you would like to credit the Photo, here are some ways you can do so
Text Link
photo Link
<span class="text-link">
<span>
<a target="_blank" href=https://pikwizard.com/photo/analytical-charts-with-data-lines-display-on-digital-screen/00604015c0957246d5e21bd7d62ea425/>PikWizard</a>
</span>
</span>
<span class="image-link">
<span
style="margin: 0 0 20px 0; display: inline-block; vertical-align: middle; width: 100%;"
>
<a
target="_blank"
href="https://pikwizard.com/photo/analytical-charts-with-data-lines-display-on-digital-screen/00604015c0957246d5e21bd7d62ea425/"
style="text-decoration: none; font-size: 10px; margin: 0;"
>
<img src="https://pikwizard.com/pw/medium/00604015c0957246d5e21bd7d62ea425.jpg" style="margin: 0; width: 100%;" alt="" />
<p style="font-size: 12px; margin: 0;">PikWizard</p>
</a>
</span>
</span>
Free (free of charge)
Free for personal and commercial use.
Author: Creative Art
Similar Free Stock Images

Premium


Premium


Premium


Premium


Premium


Premium


Premium


Premium


Premium


Premium


Premium


Premium


Premium


Premium


Premium


Premium


Premium


Premium


Premium


Premium


Premium


Premium


Premium


Premium

