
- Home >
- Stock Photos >
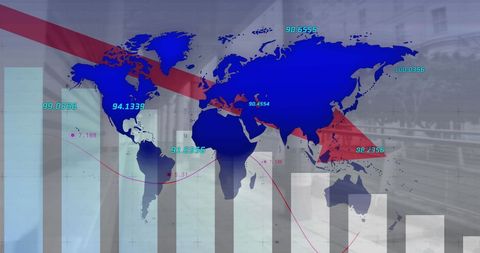
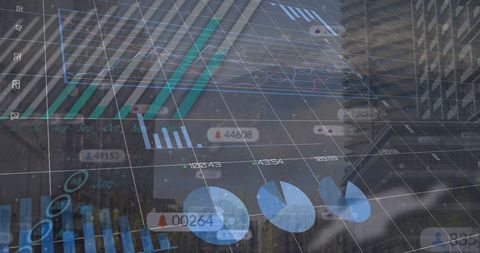
- Analytics Concept Showing Descending Graphs with Technology Interface
Analytics Concept Showing Descending Graphs with Technology Interface Image

Concept highlights financial analytics using digitally generated visuals. Images of declining graphs layered with various application icons represent data interpretation, business trends, and investment analysis. This is ideal for use in finance reports, technology reviews, data-related precision marketing, or educational materials on market analysis tools.
Powered by 


downloads
Tags:
More
Credit Photo
If you would like to credit the Photo, here are some ways you can do so
Text Link
photo Link
<span class="text-link">
<span>
<a target="_blank" href=https://pikwizard.com/photo/analytics-concept-showing-descending-graphs-with-technology-interface/ad7f5fb5191c778f69105ee1e9ae7700/>PikWizard</a>
</span>
</span>
<span class="image-link">
<span
style="margin: 0 0 20px 0; display: inline-block; vertical-align: middle; width: 100%;"
>
<a
target="_blank"
href="https://pikwizard.com/photo/analytics-concept-showing-descending-graphs-with-technology-interface/ad7f5fb5191c778f69105ee1e9ae7700/"
style="text-decoration: none; font-size: 10px; margin: 0;"
>
<img src="https://pikwizard.com/pw/medium/ad7f5fb5191c778f69105ee1e9ae7700.jpg" style="margin: 0; width: 100%;" alt="" />
<p style="font-size: 12px; margin: 0;">PikWizard</p>
</a>
</span>
</span>
Free (free of charge)
Free for personal and commercial use.
Author: Authentic Images
Similar Free Stock Images

Premium


Premium


Premium


Premium


Premium


Premium

Premium


Premium

Premium

Premium

Premium


Premium

Premium


Premium


Premium


Premium


Premium


Premium


Premium


Premium


Premium


Premium


Premium


Premium


Premium

Explore More Free Stock Images