- Home >
- Stock Photos >
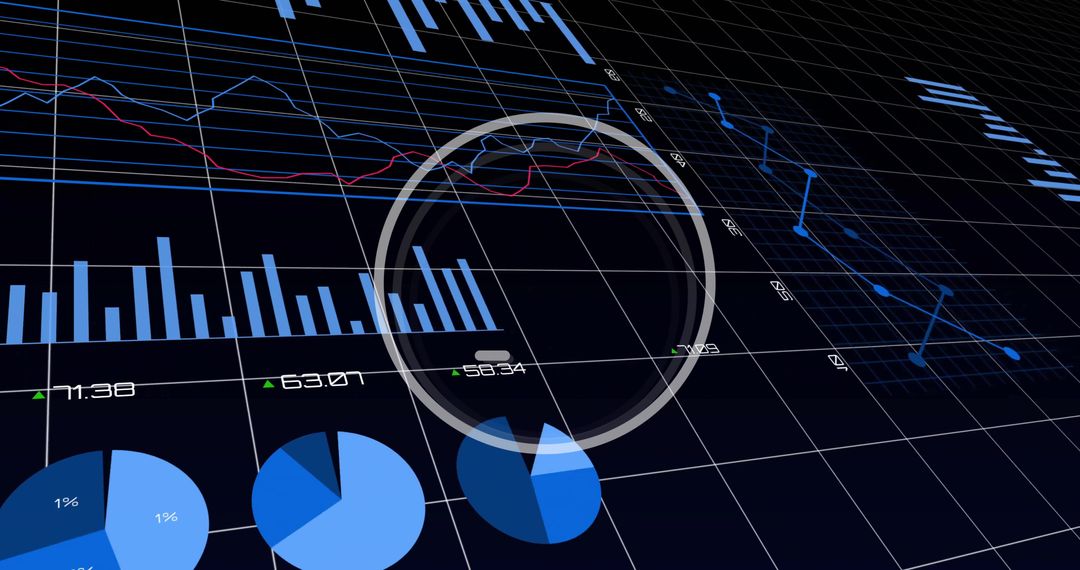
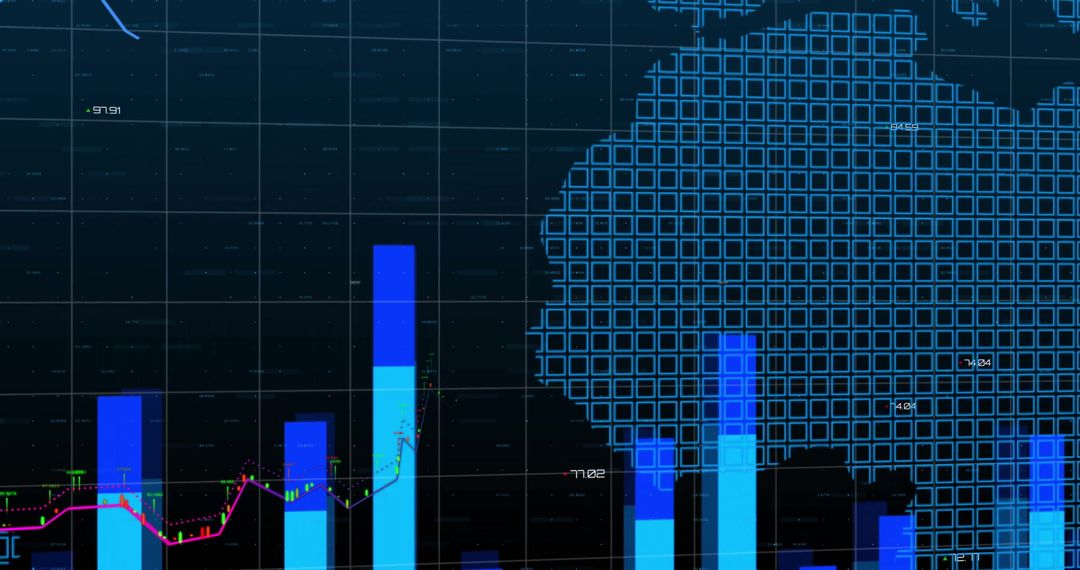
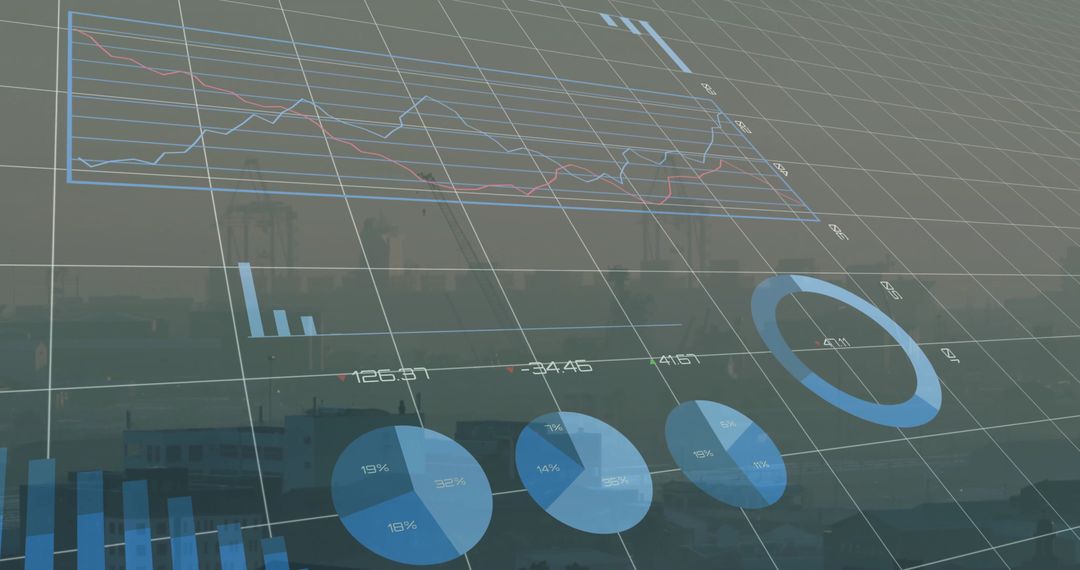
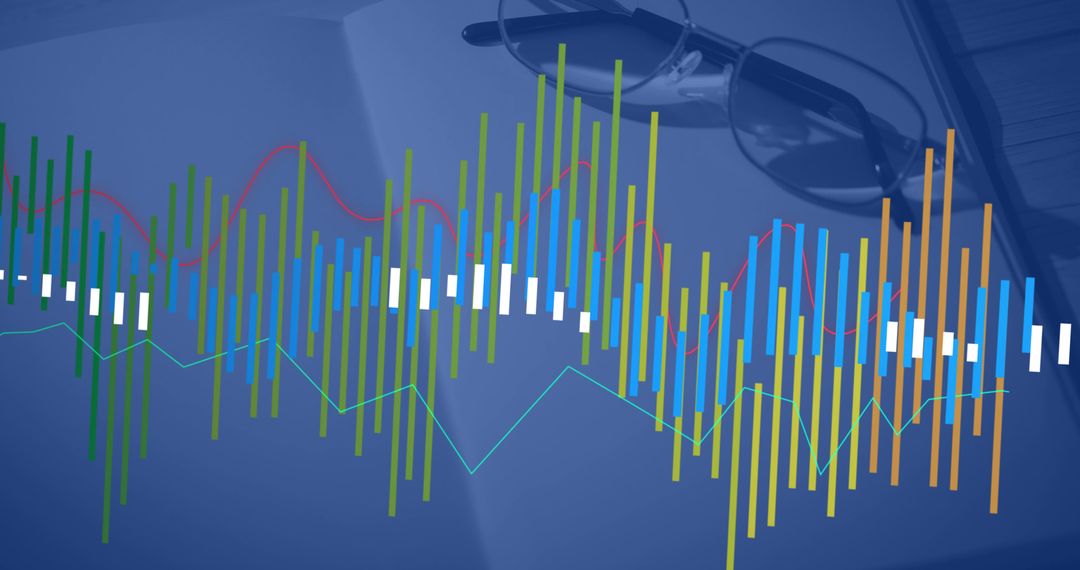
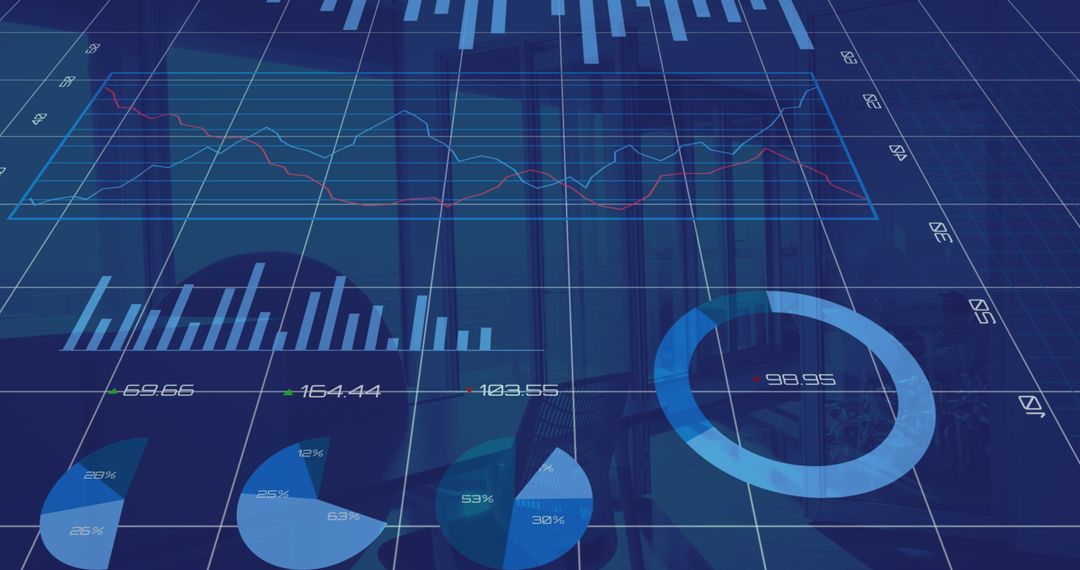
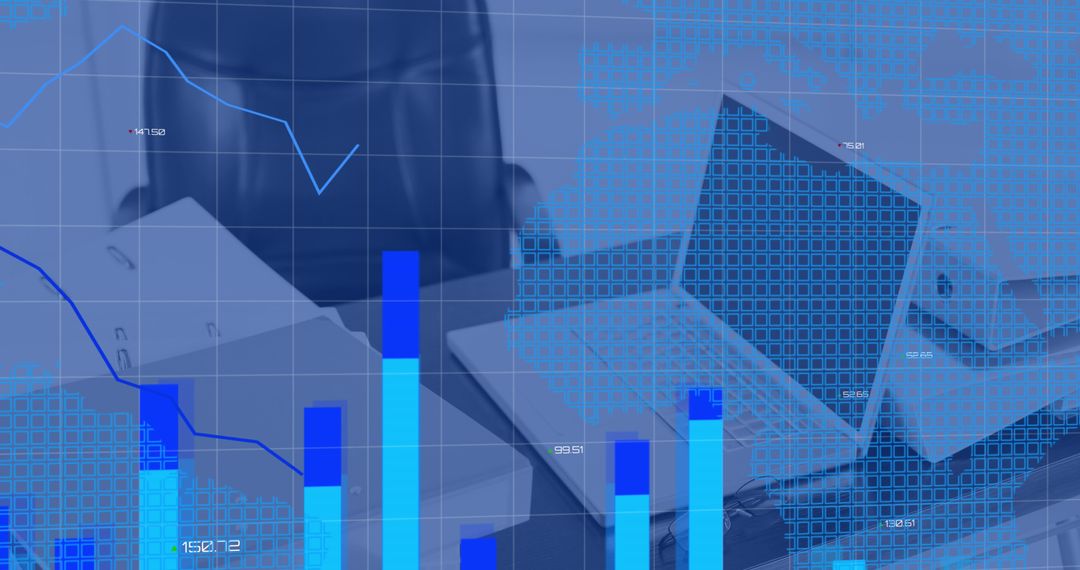
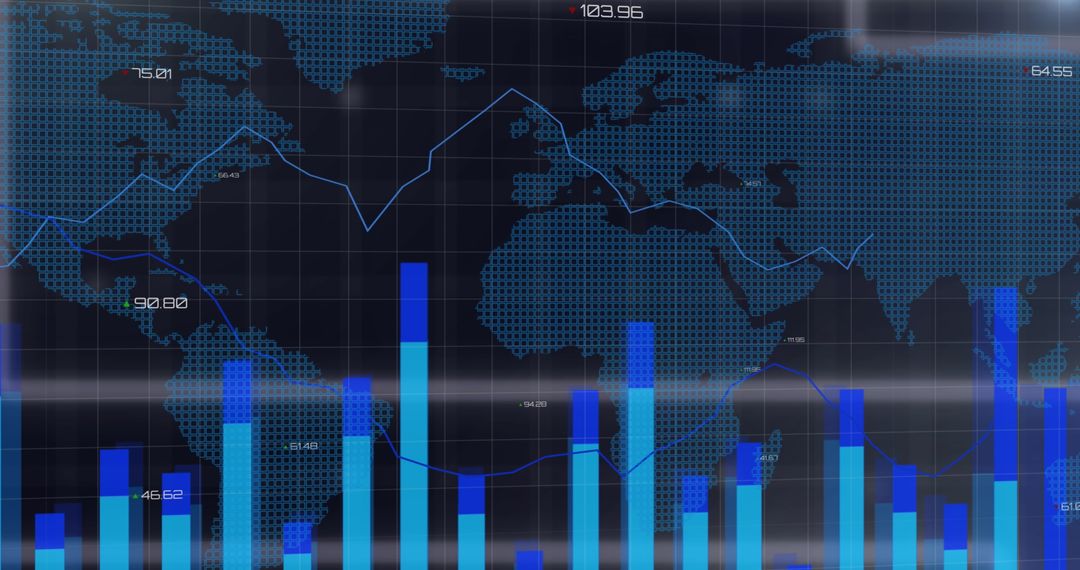
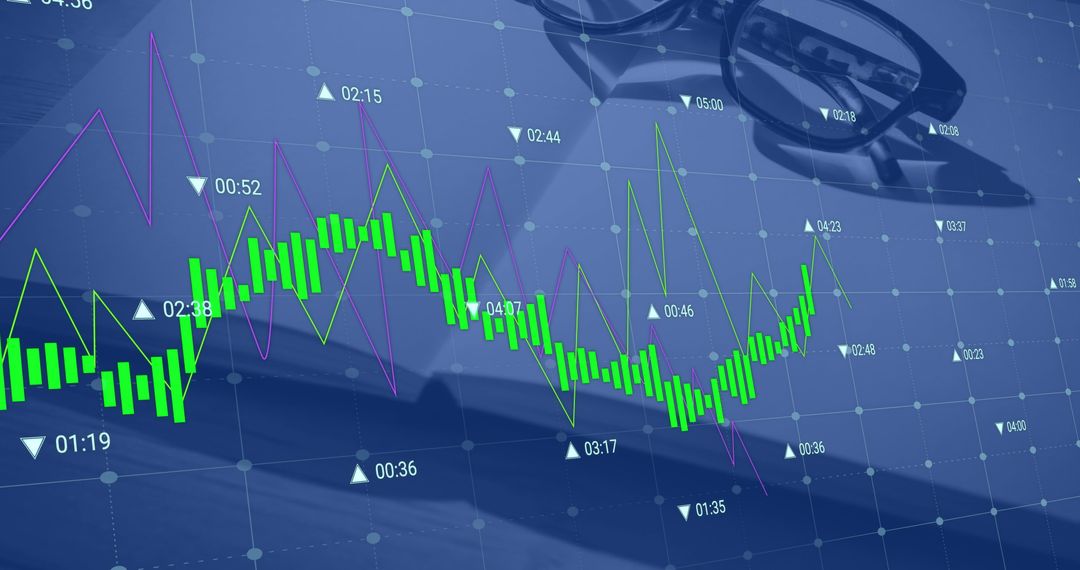
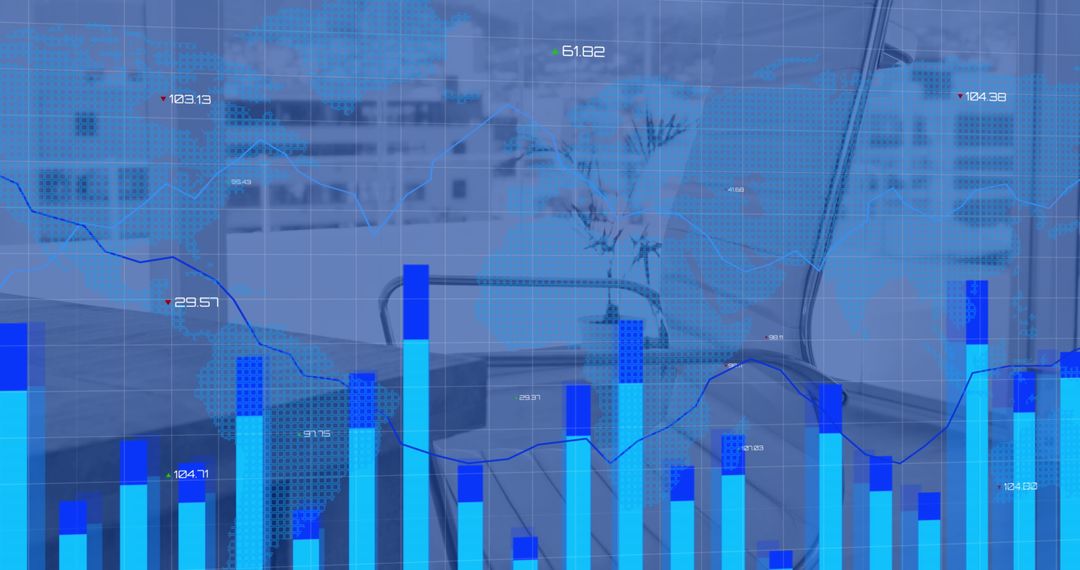
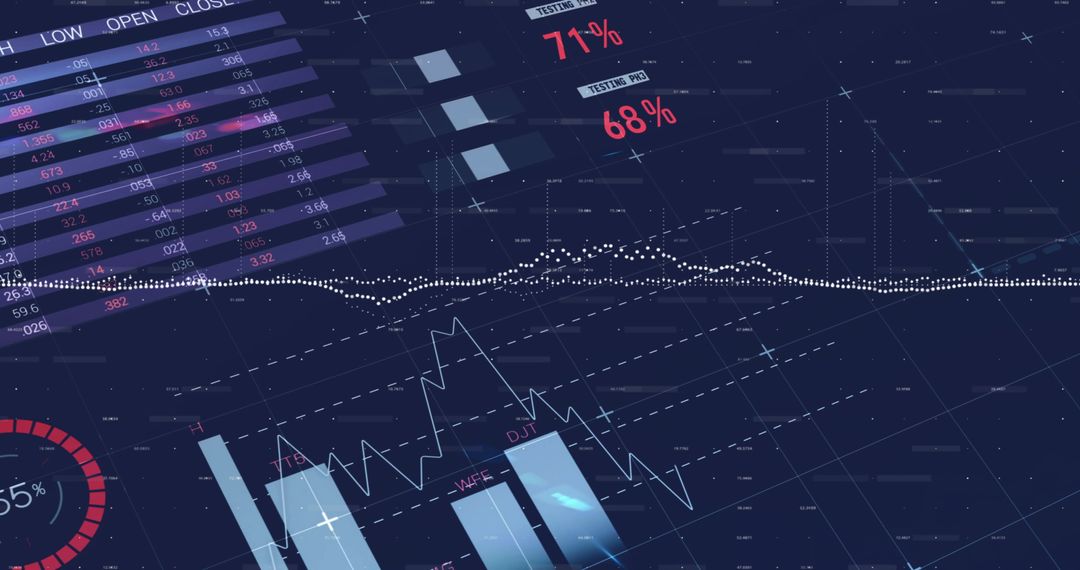
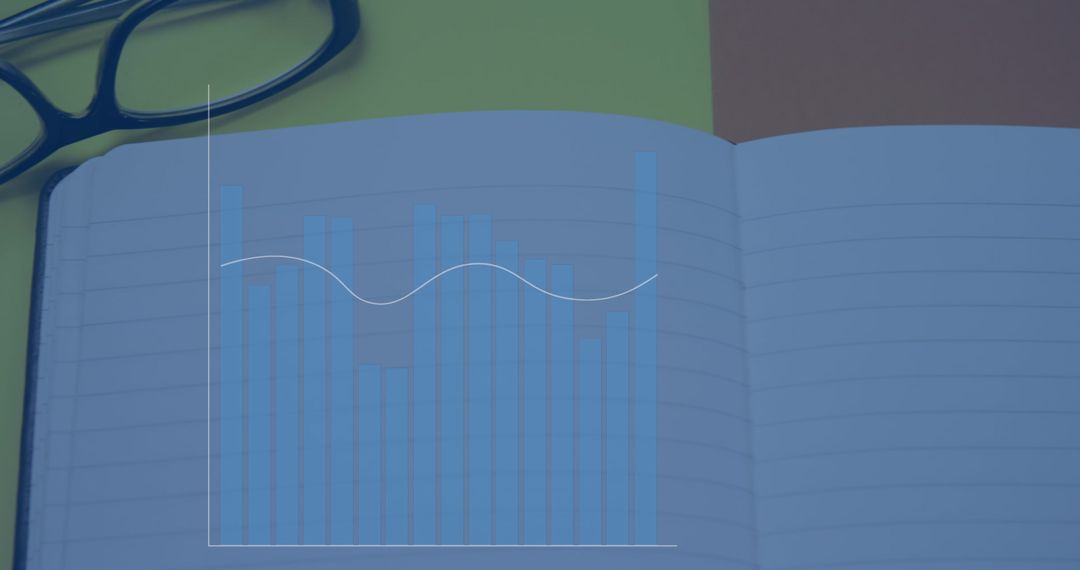
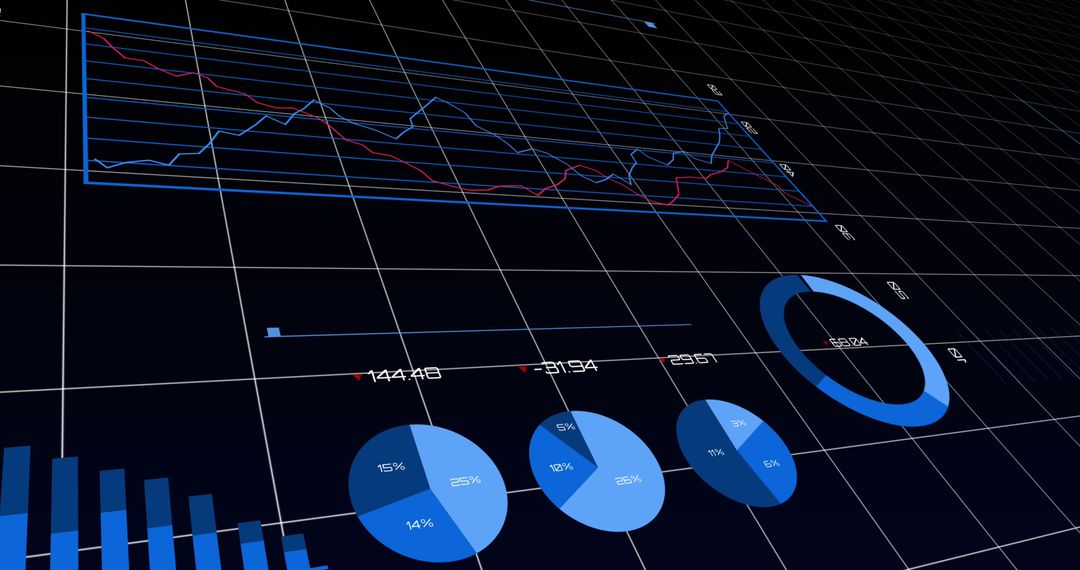
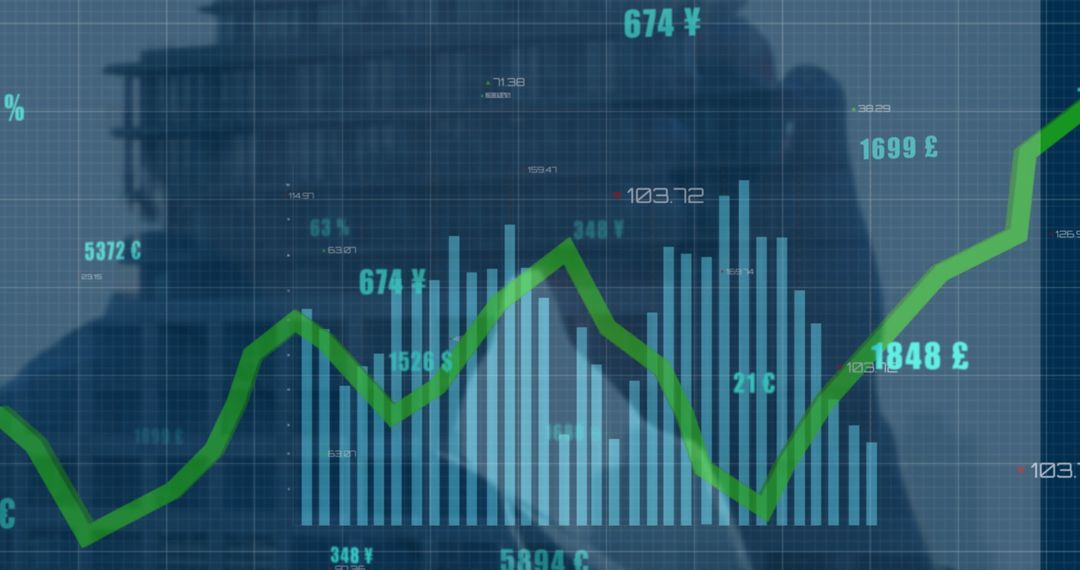
- Analytics Concepts with Bar Chart and Line Graph Overlays on Office Desk
Analytics Concepts with Bar Chart and Line Graph Overlays on Office Desk Image

This visually engaging representation shows charts and graphs blending with common office items, symbolizing the integration of technology in modern workplaces. It illustrates the analytical processes within a productive environment, using objects like a notebook, pen, and eyeglasses. Suitable for illustrating business reports, financial presentations, data-driven technology landscapes, or workspace blogs focusing on modern work strategies.
Powered by 


0
downloads
downloads
Tags:
More
Credit Photo
If you would like to credit the Photo, here are some ways you can do so
Text Link
photo Link
<span class="text-link">
<span>
<a target="_blank" href=https://pikwizard.com/photo/analytics-concepts-with-bar-chart-and-line-graph-overlays-on-office-desk/8f1a39fe90b0edc3ebecdb5ddb18ece4/>PikWizard</a>
</span>
</span>
<span class="image-link">
<span
style="margin: 0 0 20px 0; display: inline-block; vertical-align: middle; width: 100%;"
>
<a
target="_blank"
href="https://pikwizard.com/photo/analytics-concepts-with-bar-chart-and-line-graph-overlays-on-office-desk/8f1a39fe90b0edc3ebecdb5ddb18ece4/"
style="text-decoration: none; font-size: 10px; margin: 0;"
>
<img src="https://pikwizard.com/pw/medium/8f1a39fe90b0edc3ebecdb5ddb18ece4.jpg" style="margin: 0; width: 100%;" alt="" />
<p style="font-size: 12px; margin: 0;">PikWizard</p>
</a>
</span>
</span>
Free (free of charge)
Free for personal and commercial use.
Author: Authentic Images
Similar Free Stock Images
Premium


Premium


Premium


Premium


Premium


Premium


Premium


Premium


Premium


Premium


Premium


Premium


Premium


Premium


Premium


Premium


Premium


Premium


Premium


Premium


Premium


Premium


Premium


Premium