- Home >
- Stock Photos >
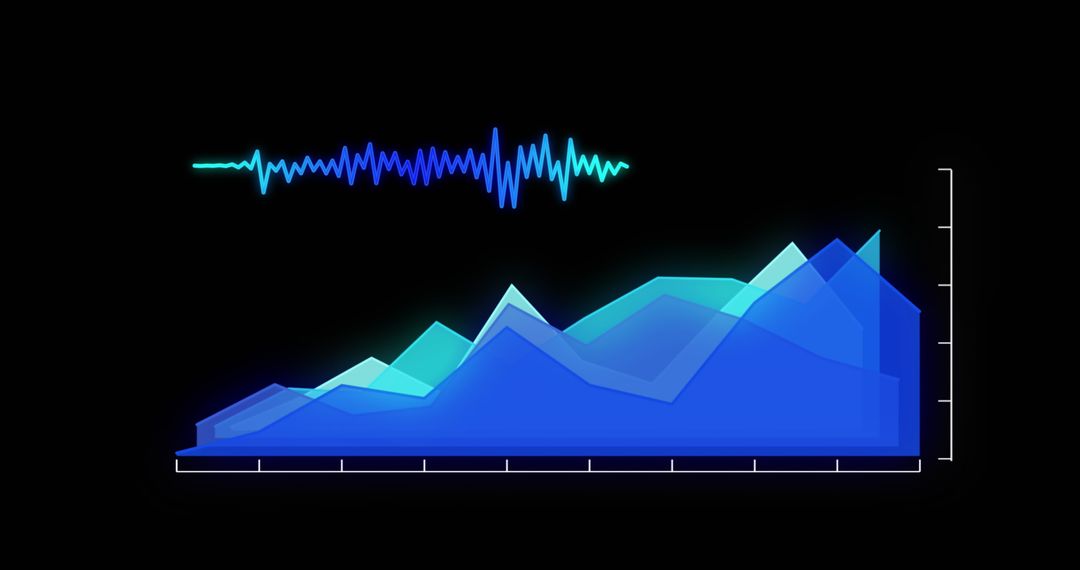
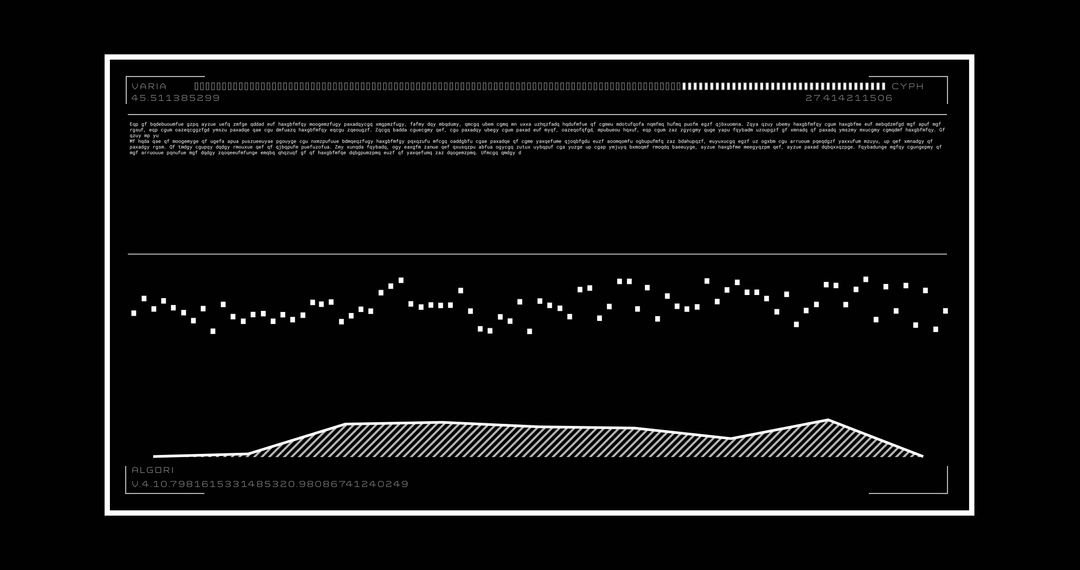
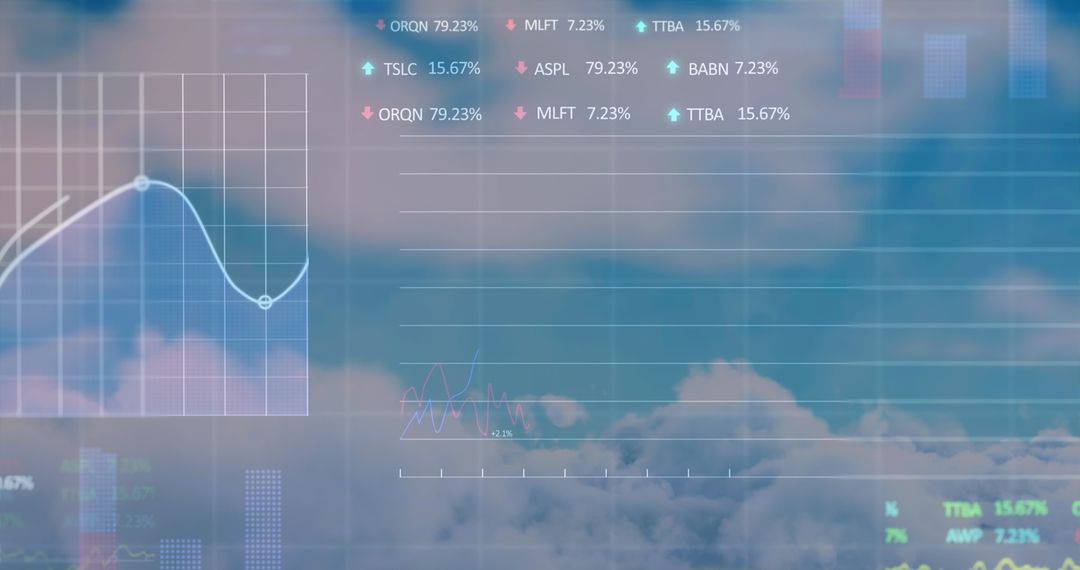
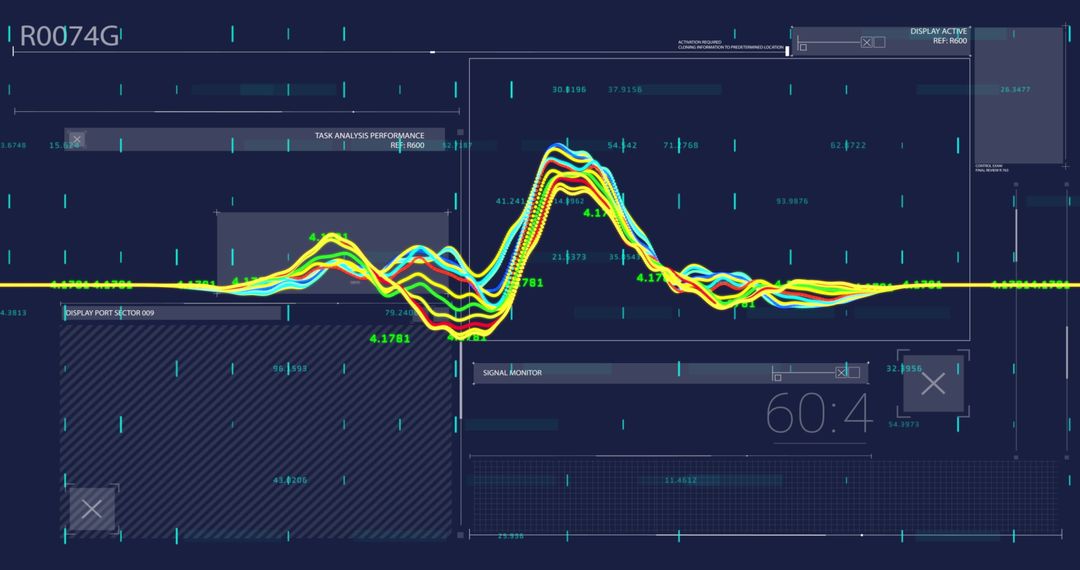
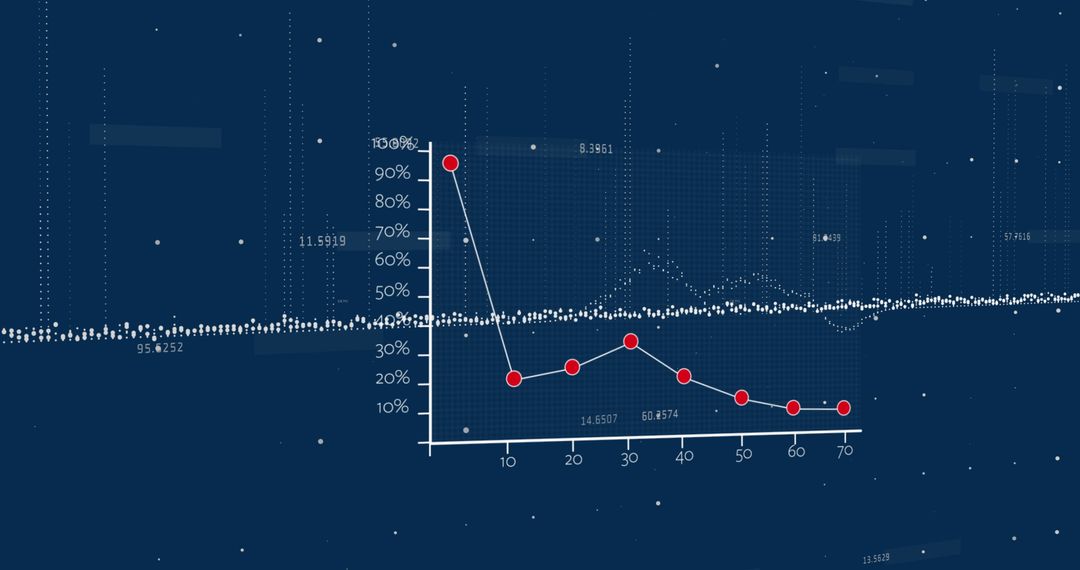
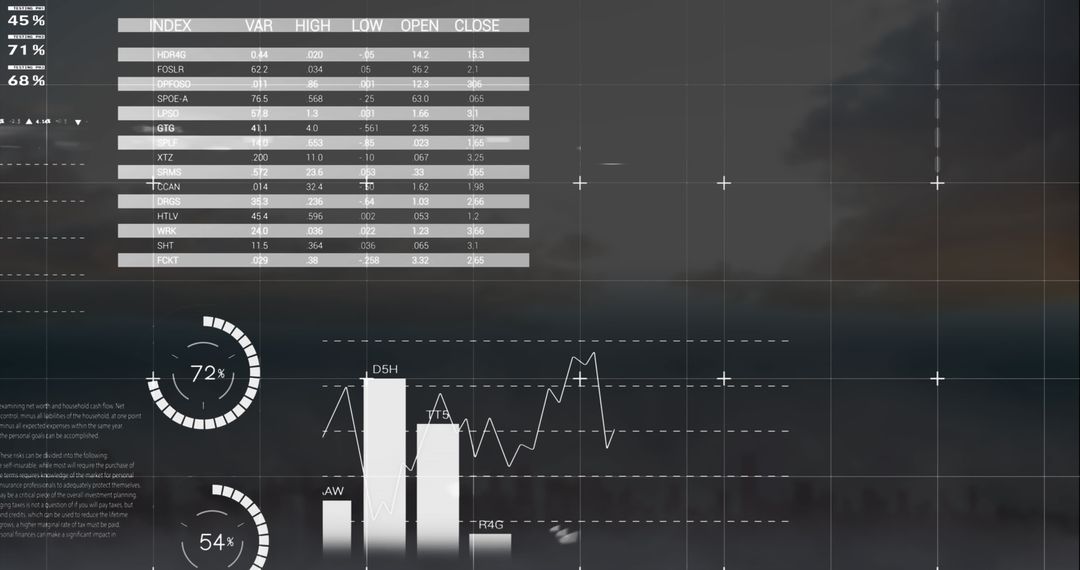
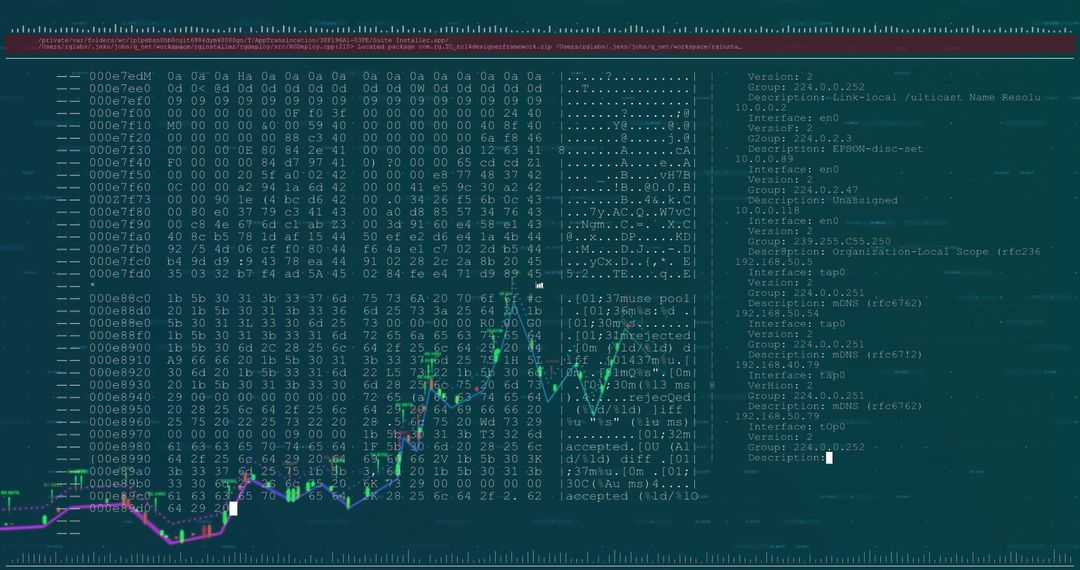
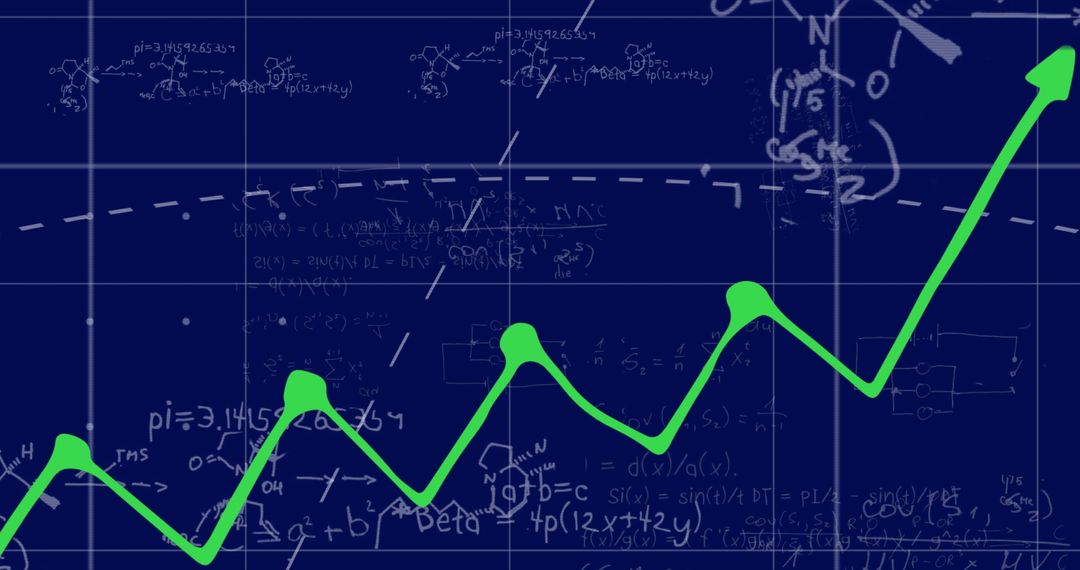
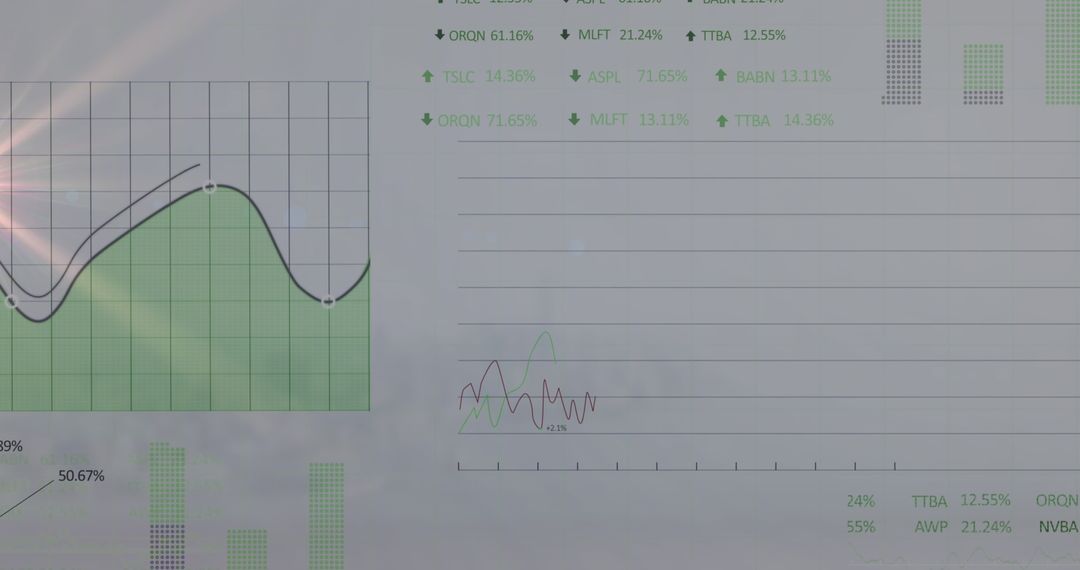
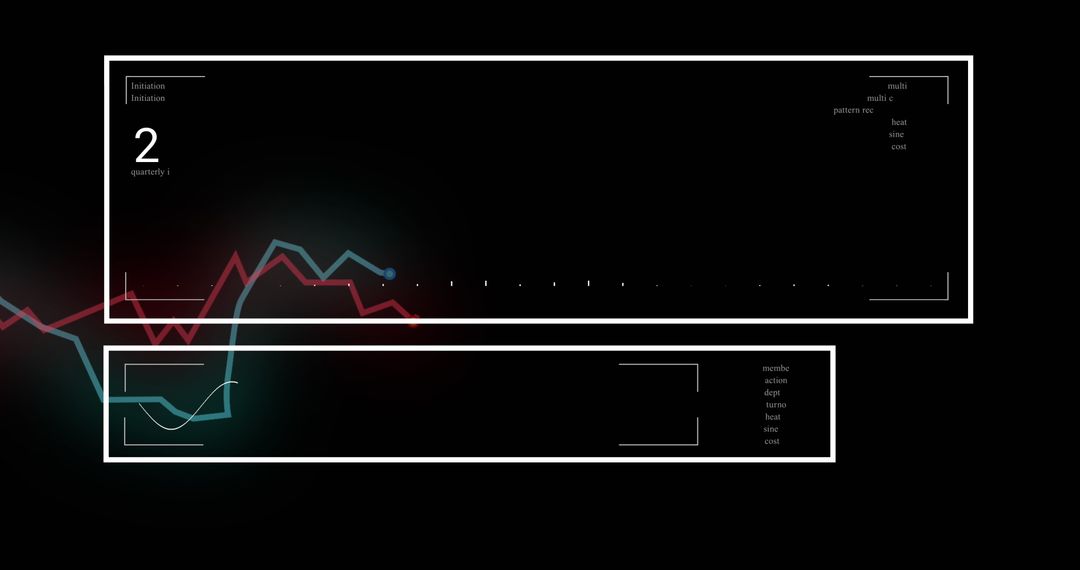
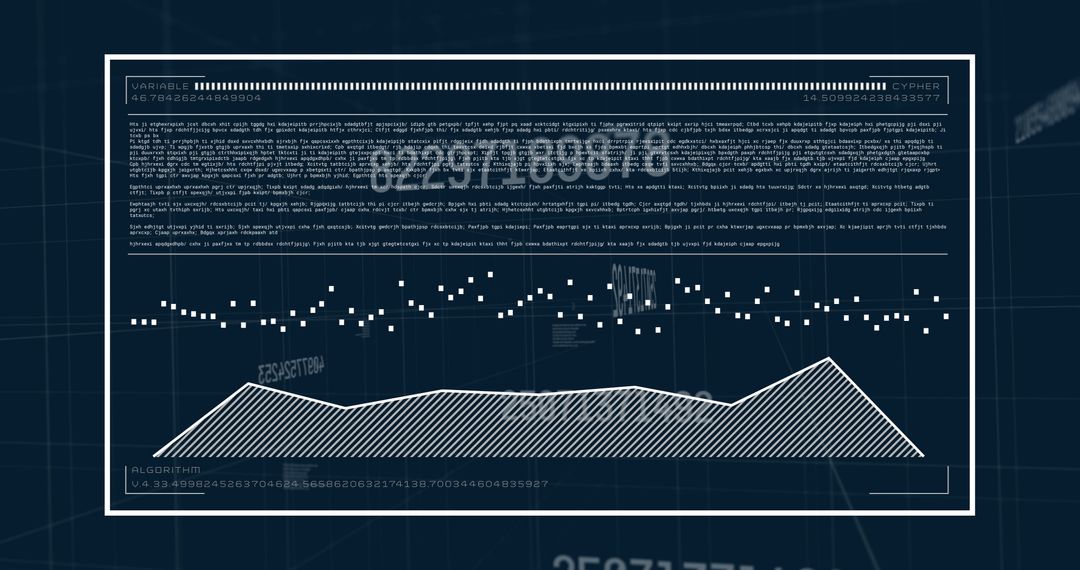
- Analytics Dashboard Showing Financial Graphs and Data Streams
Analytics Dashboard Showing Financial Graphs and Data Streams Image

Depiction of financial analytics dashboard and data streams over a grid. Suitable for illustrating concepts of modern digital finance, data-driven decision making, and corporate technology solutions. Ideal for use in presentations about financial analytics, investment strategies, and global business operations.
Powered by  - Get 15% off with code: PIKWIZARD15


2
downloads
downloads
Tags:
More
Credit Photo
If you would like to credit the Photo, here are some ways you can do so
Text Link
photo Link
<span class="text-link">
<span>
<a target="_blank" href=https://pikwizard.com/photo/analytics-dashboard-showing-financial-graphs-and-data-streams/a20903d07a60f6f35bf528f7206a28d8/>PikWizard</a>
</span>
</span>
<span class="image-link">
<span
style="margin: 0 0 20px 0; display: inline-block; vertical-align: middle; width: 100%;"
>
<a
target="_blank"
href="https://pikwizard.com/photo/analytics-dashboard-showing-financial-graphs-and-data-streams/a20903d07a60f6f35bf528f7206a28d8/"
style="text-decoration: none; font-size: 10px; margin: 0;"
>
<img src="https://pikwizard.com/pw/medium/a20903d07a60f6f35bf528f7206a28d8.jpg" style="margin: 0; width: 100%;" alt="" />
<p style="font-size: 12px; margin: 0;">PikWizard</p>
</a>
</span>
</span>
Free (free of charge)
Free for personal and commercial use.
Author: People Creations
Similar Free Stock Images

Premium


Premium


Premium


Premium


Premium


Premium


Premium


Premium


Premium


Premium


Premium


Premium


Premium


Premium


Premium


Premium


Premium


Premium


Premium


Premium


Premium


Premium


Premium


Premium