- Home >
- Stock Photos >
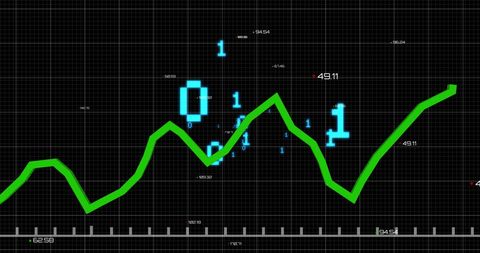
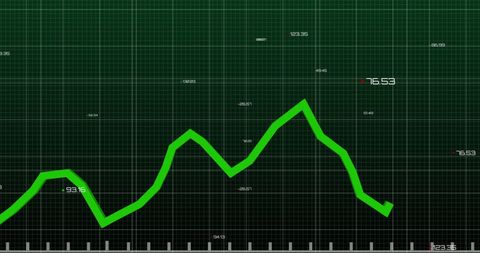
- Analytics Dashboard with Dynamic Financial Graphs and Data
Analytics Dashboard with Dynamic Financial Graphs and Data Image

Illustration displays colorful graphs on digital grid commonly representing dynamic financial or statistical data in analytics dashboards. Effective for use in presentations on data analysis, technology solutions, financial consulting, or educational content highlighting statistical trends.
Powered by  - Get 15% off with code: PIKWIZARD15


downloads
Tags:
More
Credit Photo
If you would like to credit the Photo, here are some ways you can do so
Text Link
photo Link
<span class="text-link">
<span>
<a target="_blank" href=https://pikwizard.com/photo/analytics-dashboard-with-dynamic-financial-graphs-and-data/c49a6b4cc6cf81d37df5926cbaf8bc01/>PikWizard</a>
</span>
</span>
<span class="image-link">
<span
style="margin: 0 0 20px 0; display: inline-block; vertical-align: middle; width: 100%;"
>
<a
target="_blank"
href="https://pikwizard.com/photo/analytics-dashboard-with-dynamic-financial-graphs-and-data/c49a6b4cc6cf81d37df5926cbaf8bc01/"
style="text-decoration: none; font-size: 10px; margin: 0;"
>
<img src="https://pikwizard.com/pw/medium/c49a6b4cc6cf81d37df5926cbaf8bc01.jpg" style="margin: 0; width: 100%;" alt="" />
<p style="font-size: 12px; margin: 0;">PikWizard</p>
</a>
</span>
</span>
Free (free of charge)
Free for personal and commercial use.
Author: Awesome Content