
- Home >
- Stock Photos >
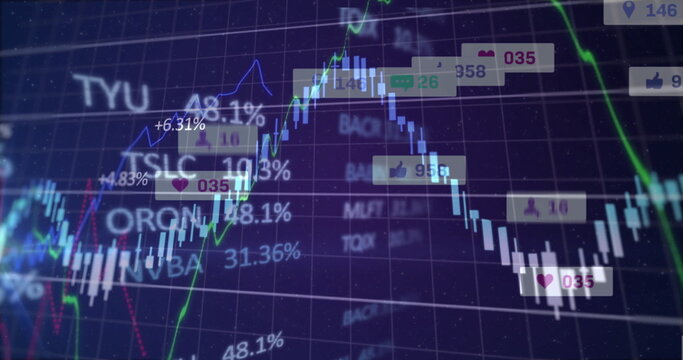
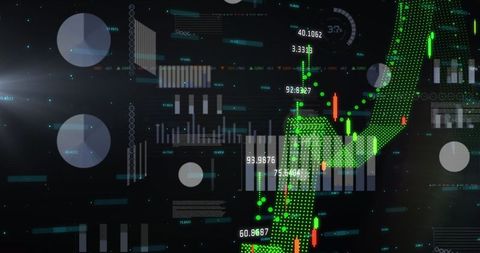
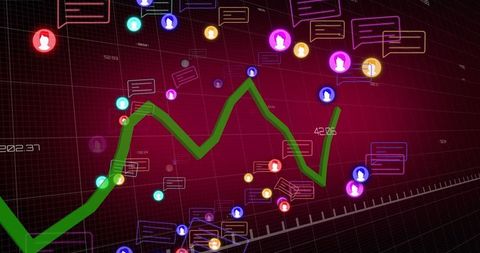
- Analytics Numbers Visualized in Neon with Trading Interface Elements
Analytics Numbers Visualized in Neon with Trading Interface Elements Image

Neon-infused trading platform scene features dynamic visual elements like candlestick chart and chat bubble interface, emphasizing data-driven analytics. Ideal for illustrating financial markets, technology, and quantitative analysis visuals spanning digital currency features, investor alerts, and educational content for trading strategies and trends.
Powered by 


downloads
Tags:
More
Credit Photo
If you would like to credit the Photo, here are some ways you can do so
Text Link
photo Link
<span class="text-link">
<span>
<a target="_blank" href=https://pikwizard.com/photo/analytics-numbers-visualized-in-neon-with-trading-interface-elements/a81eb8aa7afdd6002e137908912690d4/>PikWizard</a>
</span>
</span>
<span class="image-link">
<span
style="margin: 0 0 20px 0; display: inline-block; vertical-align: middle; width: 100%;"
>
<a
target="_blank"
href="https://pikwizard.com/photo/analytics-numbers-visualized-in-neon-with-trading-interface-elements/a81eb8aa7afdd6002e137908912690d4/"
style="text-decoration: none; font-size: 10px; margin: 0;"
>
<img src="https://pikwizard.com/pw/medium/a81eb8aa7afdd6002e137908912690d4.jpg" style="margin: 0; width: 100%;" alt="" />
<p style="font-size: 12px; margin: 0;">PikWizard</p>
</a>
</span>
</span>
Free (free of charge)
Free for personal and commercial use.
Author: Creative Art
Similar Free Stock Images

Premium

Premium

Premium


Premium


Premium


Premium

Premium

Premium

Premium


Premium


Premium


Premium


Premium

Premium


Premium


Premium

Premium

Premium


Premium


Premium

Premium


Premium

Premium


Premium

Premium


Explore More Free Stock Images