
- Home >
- Stock Photos >
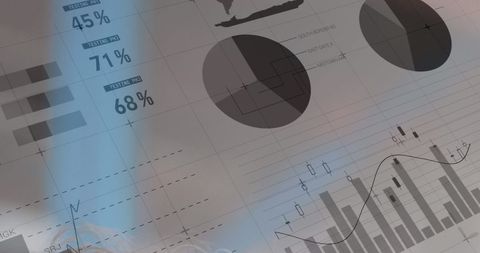
- Analyzing Business Data with Projected Graphs and Charts
Analyzing Business Data with Projected Graphs and Charts Image

Charts and graphs displayed on a surface suggest the portrayal of data and trends during a business or financial presentation. Useful for communicative design work, illustrating data-driven workflows, or emphasizing the importance of analytics and technology in a modern business environment. Ideal for business reports or educational material about information analysis.
Powered by 


downloads
Tags:
Credit Photo
If you would like to credit the Photo, here are some ways you can do so
Text Link
photo Link
<span class="text-link">
<span>
<a target="_blank" href=https://pikwizard.com/photo/analyzing-business-data-with-projected-graphs-and-charts/3ece2673103fbea960d815ab592d6948/>PikWizard</a>
</span>
</span>
<span class="image-link">
<span
style="margin: 0 0 20px 0; display: inline-block; vertical-align: middle; width: 100%;"
>
<a
target="_blank"
href="https://pikwizard.com/photo/analyzing-business-data-with-projected-graphs-and-charts/3ece2673103fbea960d815ab592d6948/"
style="text-decoration: none; font-size: 10px; margin: 0;"
>
<img src="https://pikwizard.com/pw/medium/3ece2673103fbea960d815ab592d6948.jpg" style="margin: 0; width: 100%;" alt="" />
<p style="font-size: 12px; margin: 0;">PikWizard</p>
</a>
</span>
</span>
Free (free of charge)
Free for personal and commercial use.
Author: Creative Art
Similar Free Stock Images
Loading...

Premium


Premium


Premium


Premium


Premium

Premium


Premium

Premium


Premium

Premium

Premium


Premium


Premium


Premium


Premium


Premium

Premium


Premium

Premium


Premium


Premium


Premium

Premium


Premium


Premium


Explore More Free Stock Images