- Home >
- Stock Photos >
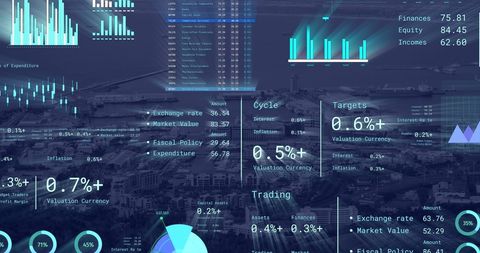
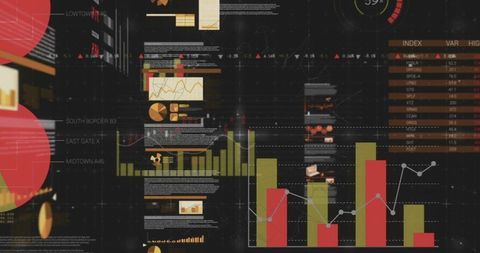
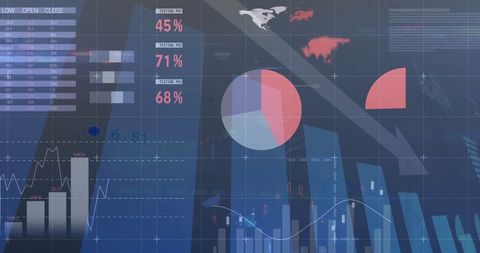
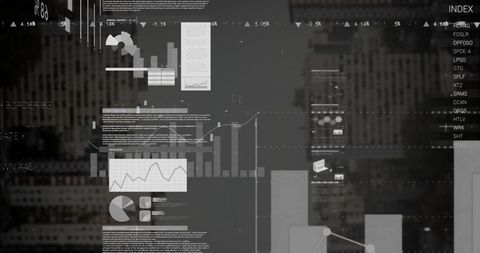
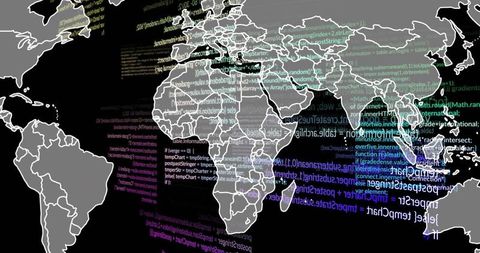
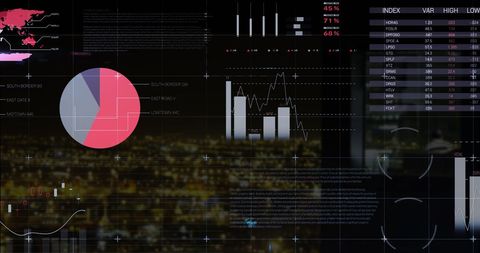
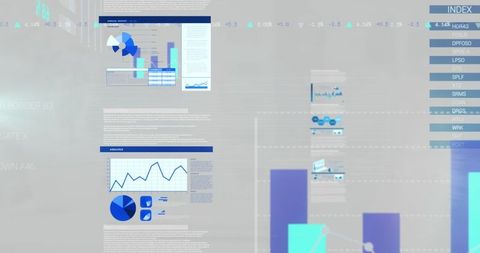
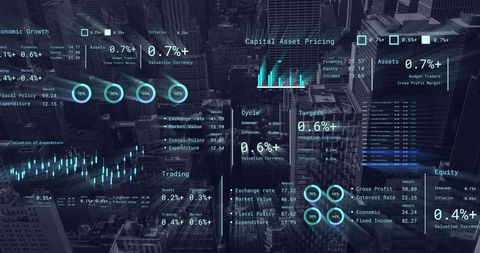
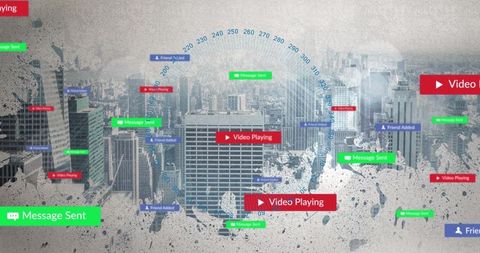
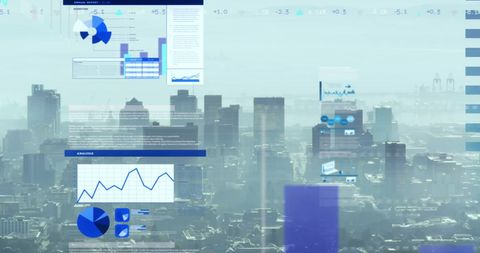
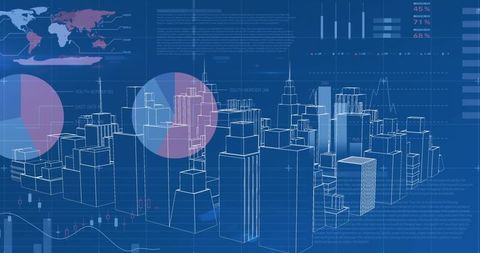
- Analyzing Complex Data Visualizations in Technology and Finance
Analyzing Complex Data Visualizations in Technology and Finance Image

Abstract representation of modern data visualizations ideal for illustrating financial or technological analysis. Highlights complexities in data processing and information systems, useful for presentations or articles on global economics or tech innovations.

downloads
Tags:
More
Credit Photo
If you would like to credit the Photo, here are some ways you can do so
Text Link
photo Link
<span class="text-link">
<span>
<a target="_blank" href=https://pikwizard.com/photo/analyzing-complex-data-visualizations-in-technology-and-finance/d41d49b545eca7c385ed2130a1b0db0c/>PikWizard</a>
</span>
</span>
<span class="image-link">
<span
style="margin: 0 0 20px 0; display: inline-block; vertical-align: middle; width: 100%;"
>
<a
target="_blank"
href="https://pikwizard.com/photo/analyzing-complex-data-visualizations-in-technology-and-finance/d41d49b545eca7c385ed2130a1b0db0c/"
style="text-decoration: none; font-size: 10px; margin: 0;"
>
<img src="https://pikwizard.com/pw/medium/d41d49b545eca7c385ed2130a1b0db0c.jpg" style="margin: 0; width: 100%;" alt="" />
<p style="font-size: 12px; margin: 0;">PikWizard</p>
</a>
</span>
</span>
Free (free of charge)
Free for personal and commercial use.
Author: People Creations