
- Home >
- Stock Photos >
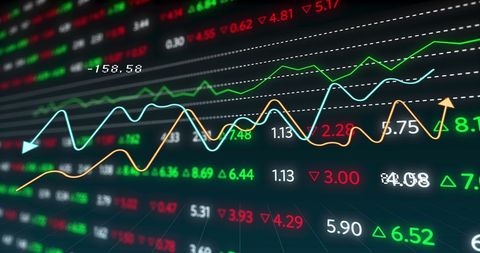
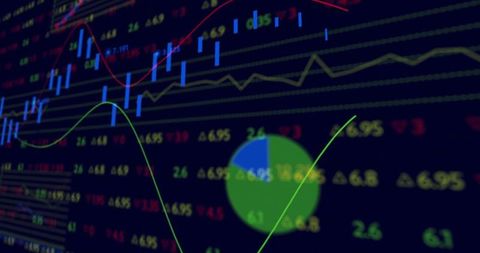
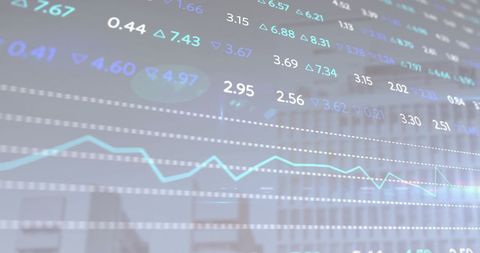
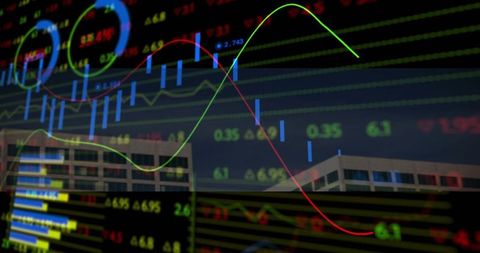
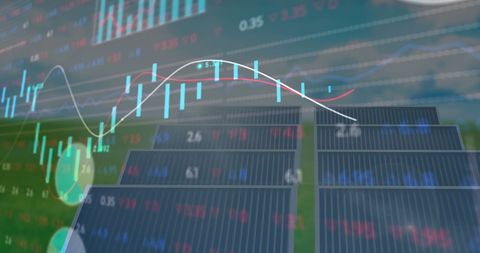
- Analyzing Complex Financial Data in Digital Display
Analyzing Complex Financial Data in Digital Display Image

Shows a sophisticated digital interface with financial graphs, useful for illustrating topics related to financial analysis, stock market trends, data interpretation, and investment strategies. Ideal for articles, presentations, or educational materials on finance and economics.
Powered by  - Get 15% off with code: PIKWIZARD15


downloads
Tags:
More
Credit Photo
If you would like to credit the Photo, here are some ways you can do so
Text Link
photo Link
<span class="text-link">
<span>
<a target="_blank" href=https://pikwizard.com/photo/analyzing-complex-financial-data-in-digital-display/cf8cf7c4d145da3b759a44a65f78c2e2/>PikWizard</a>
</span>
</span>
<span class="image-link">
<span
style="margin: 0 0 20px 0; display: inline-block; vertical-align: middle; width: 100%;"
>
<a
target="_blank"
href="https://pikwizard.com/photo/analyzing-complex-financial-data-in-digital-display/cf8cf7c4d145da3b759a44a65f78c2e2/"
style="text-decoration: none; font-size: 10px; margin: 0;"
>
<img src="https://pikwizard.com/pw/medium/cf8cf7c4d145da3b759a44a65f78c2e2.jpg" style="margin: 0; width: 100%;" alt="" />
<p style="font-size: 12px; margin: 0;">PikWizard</p>
</a>
</span>
</span>
Free (free of charge)
Free for personal and commercial use.
Author: Creative Art
Similar Free Stock Images

Premium


Premium

Premium


Premium


Premium


Premium

Premium


Premium


Premium

Premium


Premium


Premium


Premium

Premium

Premium


Premium

Premium


Premium

Premium

Premium


Premium

Premium
Premium

Premium


Premium


Explore More Free Stock Images